How to Use Your Fitness Tracker's Heart Rate Data to Train Smarter at Home
Most fitness tracker owners collect heart rate data without knowing how to act on it — this guide explains the five heart rate zones, how to calculate your personal ranges, and how to match each zone to a specific home workout goal so your tracker becomes a genuine training tool rather than a step counter.
Why Most Tracker Owners Never Use Their Heart Rate Data
Fitness trackers have gotten very good at collecting heart rate data. They monitor your pulse continuously, log it to an app, and surface it in colorful charts. What most of them don't do is tell you what to do with the numbers.
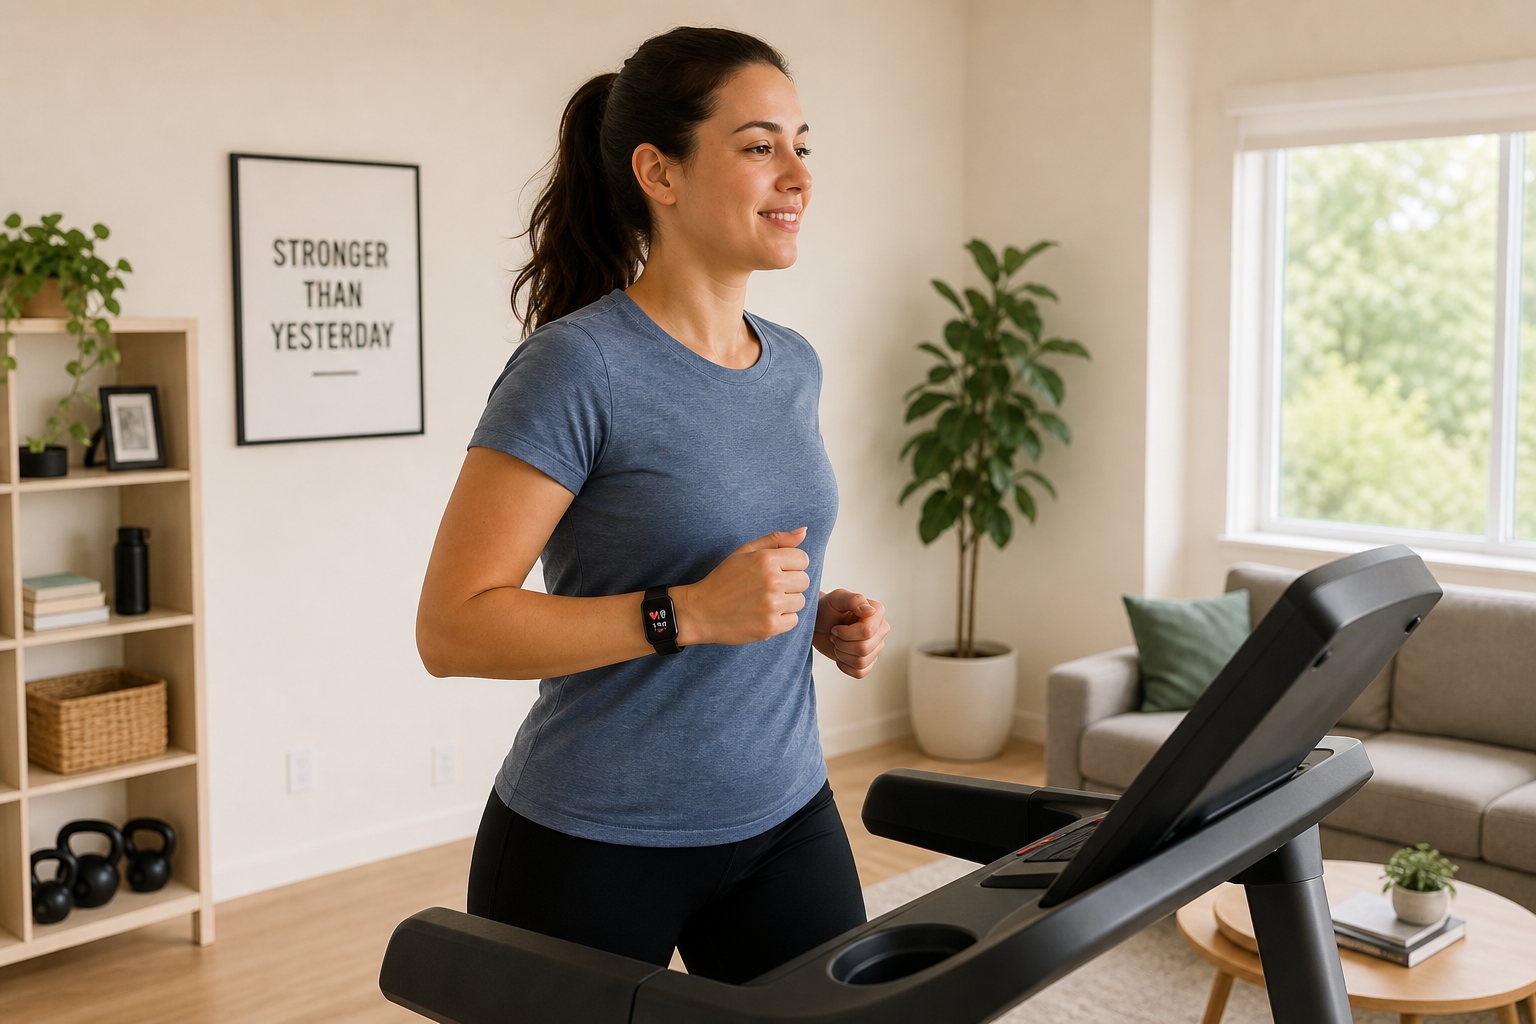
The result is a common pattern: someone buys a Garmin, Fitbit, or Apple Watch, glances at their heart rate mid-workout, notices it says 148, and has no idea whether that's ideal, too low, or too high for what they're trying to accomplish. The data exists. The knowledge to act on it doesn't.
This guide is for people who already have a tracker — or are about to get one — and want to close that gap. It covers the five heart rate training zones, how to calculate your personal ranges, where your tracker's readings are trustworthy and where they're not, and how to match each zone to a specific home workout goal. If you're still deciding which device to buy, the site's existing tracker buying guides cover device selection. This article starts where those end.
What Heart Rate Zones Are and Why They Matter for Home Workouts
Heart rate zones are percentage ranges of your maximum heart rate (MHR). Each zone corresponds to a different physiological state — how hard your cardiovascular system is working, which energy systems are dominant, and what training adaptation you're likely to get from time spent there.
In a gym class or with a personal trainer, someone else structures your intensity. At home, you're self-pacing. Without zones, most people default to a single effort level — usually moderate-to-hard — for every session. That produces a narrow range of adaptation and often leads to accumulated fatigue without the recovery or low-intensity base work that makes harder sessions productive.
Zone-based training gives you a framework to vary intensity deliberately across a week, matching each session to a specific goal rather than just "working out."
Most exercise science frameworks use a five-zone model. Zone definitions vary slightly by source — the American Heart Association, NASM, and coaches like those at Polar each use slightly different percentage thresholds. This guide uses a widely applied five-zone model anchored to percentages of maximum heart rate. The key is picking one system and applying it consistently, rather than mixing thresholds from different sources.
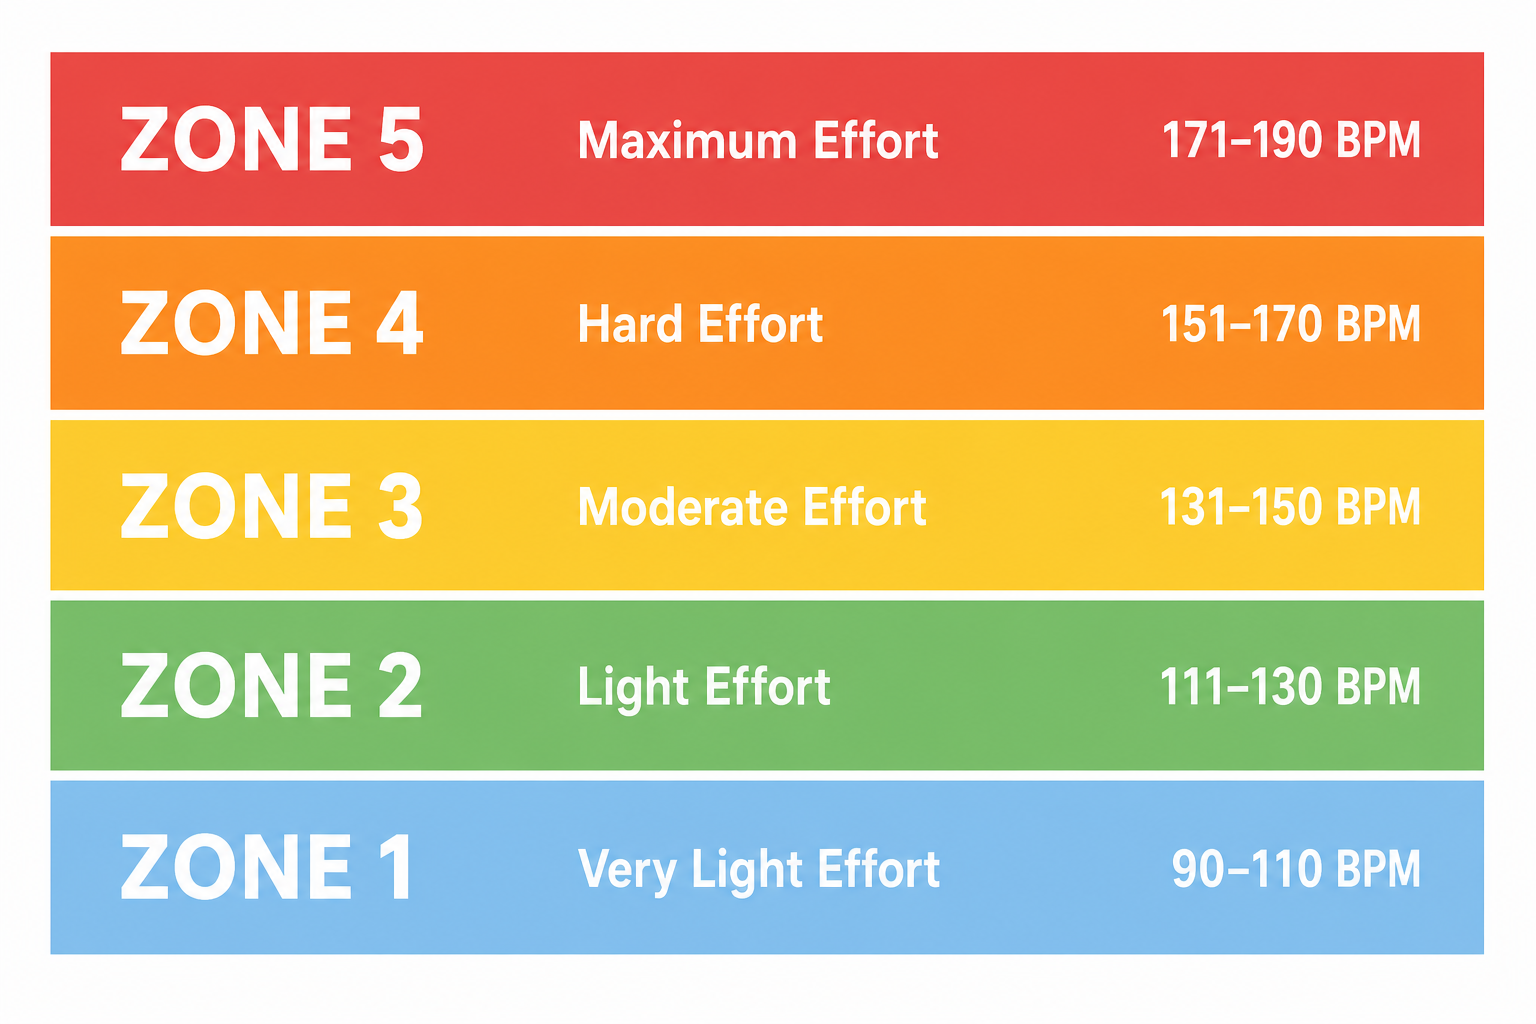
| Zone | % of MHR | Common Name | Primary Training Effect |
|---|---|---|---|
| Zone 1 | 50–60% | Active Recovery | Blood flow, recovery, very light aerobic conditioning |
| Zone 2 | 60–70% | Aerobic Base | Fat metabolism, aerobic efficiency, endurance foundation |
| Zone 3 | 70–80% | Tempo / Aerobic | General cardiovascular fitness, lactate threshold improvement |
| Zone 4 | 80–90% | Threshold | Lactate tolerance, performance capacity, VO2 max development |
| Zone 5 | 90–100% | Maximum / Anaerobic | Peak power output, anaerobic capacity, sprint performance |
How to Find Your Personal Maximum Heart Rate
Every zone percentage is anchored to your maximum heart rate, so getting a reasonable estimate of your MHR matters before any zone calculation is meaningful.
There are three practical approaches for home exercisers:
- The 220 − age formula. The most widely known method. A 40-year-old would estimate MHR as 180 bpm. Simple, but it's a population average — individual variance is commonly cited at ±10–20 bpm, meaning the formula can meaningfully over- or underestimate your actual MHR.
- The 208 − (0.7 × age) formula. A revised formula developed from a larger dataset that tends to perform better across a wider age range, particularly for people over 40. The same 40-year-old gets an estimate of 180 bpm — similar in this case, but the formula diverges more meaningfully at older ages.
- A field test. The most individually accurate method. After a thorough warm-up, perform a progressively harder effort — a hard 3-minute interval on a treadmill or stationary bike, followed by a 1-minute all-out push — and note the highest heart rate your tracker records. This reflects your actual physiology rather than a statistical estimate.
Once you have an MHR estimate, multiply it by the zone percentages in the table above to get your personal bpm ranges. Most tracker apps — Garmin Connect, Fitbit, Apple Fitness — let you enter a custom MHR so the device calculates zones based on your number rather than its default formula.
The Five Heart Rate Zones: What Each One Feels Like and When to Use It
Knowing the percentages is useful. Knowing what each zone actually feels like during a home workout is more useful, because your tracker's real-time reading isn't always perfectly accurate (more on that shortly). Perceived effort is a reliable backup signal.
| Zone | % MHR | How It Feels | Can You Talk? | Home Workout Example |
|---|---|---|---|---|
| Zone 1 | 50–60% | Very light effort. You could hold a full conversation comfortably. | Full sentences easily | Slow walk on treadmill, gentle cycling, light mobility work |
| Zone 2 | 60–70% | Comfortable but clearly working. You can speak in full sentences but wouldn't want to sing. | Full sentences with some effort | Brisk treadmill walk or easy jog, steady stationary bike, light bodyweight circuit |
| Zone 3 | 70–80% | Moderately hard. Conversation requires effort — short sentences, not paragraphs. | Short phrases only | Moderate jog, tempo bike ride, sustained bodyweight circuit with minimal rest |
| Zone 4 | 80–90% | Hard and uncomfortable. Speaking is difficult. You're aware of your breathing. | A few words at most | HIIT work intervals, hard cycling intervals, fast bodyweight circuits |
| Zone 5 | 90–100% | Near-maximum effort. Unsustainable beyond 30–60 seconds. No conversation possible. | Not possible | Sprint intervals on treadmill, all-out cycling sprints, plyometric bursts |
Zone 2: The Most Underused Zone for Home Exercisers
Zone 2 deserves specific attention because it's the zone most beginners skip without realizing it. At 60–70% of MHR, Zone 2 feels almost too easy — like you're not working hard enough to make it count. That perception is wrong.
Zone 2 is where your body builds its aerobic base: improving mitochondrial density, training your cardiovascular system to deliver oxygen efficiently, and developing the fat-metabolism pathways that support sustained effort at any intensity. Without a solid Zone 2 foundation, harder training sessions produce diminishing returns and accumulate fatigue faster.
For home exercisers on a treadmill or stationary bike, Zone 2 often means a pace that feels frustratingly slow at first. That's the point. Sustained Zone 2 sessions — 30 to 60 minutes, two to three times per week — build the cardiovascular infrastructure that makes everything else more effective.
How Your Tracker Displays Zone Data — and Where It Falls Short
Most fitness trackers display your current heart rate zone on screen or in their companion app. That display is genuinely useful during steady-state cardio — a consistent treadmill jog or a steady stationary bike ride. It becomes less reliable in specific situations.
Wrist-based optical heart rate sensors work by shining light through your skin and measuring blood volume changes. The technology is solid for stable, rhythmic activities. During rapid intensity changes — like HIIT intervals where you go from rest to sprint in seconds — optical sensors typically lag 30 to 60 seconds behind your actual heart rate. By the time your tracker shows you're in Zone 4, your work interval may already be over.
Several additional factors affect real-time accuracy on wrist-worn devices:
- Skin tone and wrist tattoos can reduce optical sensor accuracy by interfering with light absorption and reflection.
- Strength training — where your forearm muscles contract hard against the band — often produces erratic readings because the sensor loses consistent skin contact.
- Loose fit. A tracker worn too loosely moves around during exercise, disrupting the sensor's contact with your skin.
- Cold temperatures can reduce peripheral blood flow, making optical readings less stable.
The practical implication: use the talk test and perceived effort as your primary zone signal during high-intensity intervals. Use your tracker's reading as a confirmation after the fact — checking your post-workout zone distribution in the app is more informative than trying to hit a specific zone in real time during a HIIT session.
Matching Zones to Home Workout Goals
Each zone produces different physiological outcomes. Matching your target zone to your actual goal — rather than just working as hard as you can every session — is what makes zone-based training practical.
| Goal | Primary Zone(s) | Session Type | Why It Works |
|---|---|---|---|
| Active recovery | Zone 1 | Easy walk, gentle cycling, mobility flow | Promotes blood flow and muscle repair without adding training stress |
| Aerobic base building | Zone 2 | Sustained treadmill jog, steady bike ride (30–60 min) | Builds mitochondrial density and fat-metabolism efficiency over weeks |
| General cardiovascular fitness | Zone 3 | Tempo jog, moderate-intensity bodyweight circuit | Improves lactate threshold and sustained aerobic capacity |
| Fat loss support | Zones 2–3 | Longer steady-state sessions, moderate circuits | Supports caloric expenditure and metabolic health; not a magic fat-burning switch |
| HIIT / peak power | Zones 4–5 (intervals) | Sprint intervals, hard cycling bursts, plyometric circuits | Develops VO2 max, anaerobic capacity, and post-exercise calorie burn |
| Endurance improvement | Zones 2–3 (majority) | Long Zone 2 sessions with occasional Zone 3 tempo work | Builds the aerobic base that supports all higher-intensity training |
A common mistake is treating every session as an opportunity to push hard. Zones 4 and 5 are productive in small doses — typically no more than one or two sessions per week for most recreational exercisers. The majority of training volume, for most goals, should sit in Zones 2 and 3.
A Sample Weekly Zone Distribution for Home Exercisers
The following is a template for a four-to-five day training week that distributes effort across multiple zones. Adapt the specific activities to whatever equipment you have — the zone targets and session structure are what matter, not the exact workout format.
| Day | Zone Target | Session Type | Duration |
|---|---|---|---|
| Monday | Zone 2 | Steady treadmill jog or stationary bike at conversational pace | 40–50 min |
| Tuesday | Zone 4–5 | HIIT intervals: 30 sec hard / 90 sec easy, repeated 8–10 times | 25–30 min total |
| Wednesday | Zone 1 | Active recovery: slow walk, light mobility or foam rolling | 20–30 min |
| Thursday | Zone 3 | Tempo bodyweight circuit or moderate-pace treadmill run | 30–40 min |
| Friday | Zone 2 | Longer aerobic session: bike ride or jog at easy, sustained effort | 45–60 min |
| Saturday | Rest or Zone 1 | Full rest, or very light movement (walk, stretching) | — |
| Sunday | Rest | Full recovery | — |
Three Heart Rate Zone Myths Worth Correcting
- "The fat-burning zone is the best zone for weight loss." Zone 2 does use a higher proportion of fat as fuel relative to carbohydrates. But proportion isn't the same as total amount. Higher-intensity zones burn more total calories per minute, including fat calories. The "fat-burning zone" label is technically accurate but practically misleading — it implies that lower intensity is always better for fat loss, which isn't supported by how total energy expenditure works. Zone 2 is valuable for aerobic base building and metabolic health, not because it's a fat-loss shortcut.
- "More intensity always means faster results." Training exclusively in Zones 4 and 5 without adequate Zone 1–2 recovery produces accumulated fatigue, increased injury risk, and diminishing returns over weeks. This pattern — sometimes called overreaching or chronic high-intensity overtraining — is common among home exercisers who equate harder with better. A week that includes two hard sessions and two or three easier Zone 2 sessions typically produces better long-term adaptation than five hard sessions.
- "My age-based MHR formula is accurate." The 220 − age formula is a population average derived from group data. Individual maximum heart rates commonly vary by 10 to 20 bpm from the formula's prediction. Someone whose actual MHR is 175 but whose formula says 190 will be training in the wrong zone if they use the formula uncritically. Use the formula as a starting estimate, then adjust based on perceived effort and, if appropriate, a supervised field test.
When to Trust Your Tracker's Zone Reading — and When to Go by Feel
Optical heart rate sensors are not equally reliable across all workout types. Knowing when to trust your tracker's real-time reading — and when to rely on perceived effort instead — makes zone-based training more practical.
- Trust your tracker during steady-state cardio. Treadmill jogging at a consistent pace, stationary cycling at a stable resistance, or a sustained elliptical session all give optical sensors time to stabilize. Zone readings during these activities are generally reliable within a few beats.
- Use perceived effort during HIIT. The 30–60 second sensor lag means your tracker is showing you where your heart rate was, not where it is. During a 30-second sprint interval, the reading is essentially irrelevant in real time. Use the talk test and your sense of effort to gauge intensity, then check your post-workout zone distribution in the app.
- Disregard zone readings during strength training. Forearm muscle contractions during weightlifting frequently produce erratic optical readings. Heart rate during strength work is also a less meaningful training signal than it is during cardio — the cardiovascular demand is real but doesn't map cleanly to the zone model.
- Use resting heart rate trend as your long-term fitness signal. Resting heart rate (RHR) measured first thing in the morning, before getting out of bed, is the most reliable cardiovascular metric any basic tracker can deliver. As aerobic fitness improves over weeks and months, RHR typically declines. A downward trend in RHR over four to eight weeks is a meaningful signal that your Zone 2 training is working — more reliable than any single workout's zone data.
Common Questions About Heart Rate Zone Training
- How long should I train in Zone 2? Zone 2 sessions are most effective when they're long enough for your aerobic system to adapt — generally 30 minutes at minimum, with 45 to 60 minutes being more effective for base building. Shorter Zone 2 sessions still contribute, but the adaptation signal is stronger with sustained effort. Two to three Zone 2 sessions per week is a common starting point.
- Can I do HIIT every day? For most people, daily HIIT is counterproductive. High-intensity training (Zones 4–5) creates significant physiological stress that requires 48 hours or more to recover from. Training hard before that recovery is complete accumulates fatigue rather than building fitness. One to two HIIT sessions per week, surrounded by Zone 1–2 recovery and aerobic base work, is a more sustainable structure.
- Does Zone 2 actually burn fat? Yes — Zone 2 uses fat as its primary fuel source. But higher-intensity zones also burn fat, and burn more total calories per minute. Zone 2 is valuable for building aerobic efficiency and fat-metabolism capacity over time, not because it's uniquely superior to other zones for fat loss in any single session.
- What is a good resting heart rate? For most adults, a resting heart rate between 60 and 100 bpm is considered within the normal range. Fit individuals often see RHR in the 50s or even lower. What matters most is your personal trend over time — a declining RHR over weeks of consistent training is a positive adaptation signal. If your resting heart rate is consistently above 100 bpm, or if you notice a sudden unexplained elevation, consult your healthcare provider.
This result comes from one real apartment under the stated conditions — it is a strong signal, not a guarantee your space will measure identically.
Builds this evidence supports
No build currently links to this specific test. Browse all builds with a matching tag.
Spot something off?
If this result didn't match your own space, let us know — floor-damage and noise claims carry real deposit-risk consequences if we get them wrong.