How to Actually Use Your Wearable Activity Tracker's Recovery Data
Most wearable activity tracker owners collect HRV, readiness, and sleep data they never act on. This guide explains what your tracker is genuinely measuring versus estimating, how to build a personal baseline, and how to apply a simple four-signal framework to make concrete adjustments to your home workouts.

The Data Gap: Collecting Recovery Numbers You Can't Act On
If you own a wearable activity tracker, you probably check your recovery score most mornings. You see a number — 74, or a green ring, or a readiness score of 82 — and then you do whatever you were already planning to do. The data sits there, collected and ignored.
This is the normal experience for most home fitness practitioners training without a coach. The tracker is generating real physiological data every night. The problem is not the data — it's that nobody handed you a framework for translating it into actual workout decisions.
This guide is not a device review, and it's not an HRV science lecture. It's a practical system for self-coached exercisers: what your tracker is genuinely measuring versus estimating, how to build a personal baseline that makes individual readings meaningful, and how to apply a simple four-signal framework to make concrete adjustments to your training — with your own subjective feel always serving as a cross-check.
What Your Tracker Actually Measures vs. What It Estimates
The most important distinction in wearable recovery data is one that device marketing actively blurs: the difference between a true physiological measurement and an algorithmic estimate.
Heart rate variability — specifically the RMSSD metric — is a validated physiological measurement. It captures the variation in time between consecutive heartbeats during sleep, and it directly reflects the state of your autonomic nervous system, particularly parasympathetic (rest-and-digest) activity. When your body has recovered well, RMSSD tends to be higher. When you're under stress — physical or otherwise — it tends to drop. This relationship is well-established in peer-reviewed research and is the same regardless of which device measures it.
Resting heart rate (RHR) is similarly a direct measurement. Sleep staging — light, deep, REM — is an estimate derived from movement and heart rate signals, but it's based on validated algorithms compared against polysomnography (clinical sleep lab data). Skin temperature deviation is a raw sensor reading.
Readiness scores are a different category entirely. Whoop's Recovery percentage, Oura's Readiness score, Garmin's Training Readiness, and Fitbit's Daily Readiness Score are all algorithmic constructs — they combine multiple inputs using proprietary weightings that are not publicly disclosed. As data scientist and Oura advisor Marco Altini has written, these scores are not physiological measurements:
One specific problem Altini identifies: if a readiness score includes both your sleep quality and your HRV — and a poor night of sleep suppressed your HRV — you get penalized twice for the same event. The score becomes less informative, not more.
- True measurements: RMSSD (HRV), resting heart rate, skin temperature deviation
- Validated estimates: sleep staging (light, deep, REM) — derived from sensors, compared against clinical polysomnography
- Algorithmic constructs: Whoop Recovery %, Oura Readiness, Garmin Training Readiness, Body Battery — useful directional guides, not validated standalone verdicts
How Whoop, Oura, and Garmin Approach Recovery Differently
The three dominant recovery-focused platforms each ask a different question about your body. Understanding which question each device is designed to answer helps you choose the right tool — and interpret its output correctly.
Whoop is built around the strain-to-recovery relationship. Its core question is: how much did you load your system today, and how recovered are you for tomorrow? It's optimized for daily load management and is most useful for home fitness practitioners who train frequently and want to understand whether yesterday's session has been absorbed.
Oura leads with sleep. Its core question is: how well did you sleep, and is your body ready to perform today? Among the three platforms, Oura Gen 4 currently leads in raw HRV measurement accuracy. A 2025 peer-reviewed study tested five wearable devices against ECG across 536 nights, and Oura Gen 4 achieved a concordance correlation coefficient (CCC) of 0.99 with a mean absolute percentage error (MAPE) of 5.96% for HRV — the highest accuracy of all devices tested. For sleep staging, Oura Gen 3 reached approximately 91.7% overall accuracy against polysomnography across 96 participants. Oura is the strongest choice for home fitness practitioners who prioritize sleep quality as their primary recovery input.
Garmin Training Readiness takes the broadest view. It combines six inputs — sleep score, recovery time countdown, HRV Status (a 7-day rolling average versus your personal baseline), acute training load, sleep history across prior nights, and a three-day stress history window — into a single readiness score. Garmin explicitly states this score is not designed to predict performance, and advises users to consider it alongside how they feel. Critically, Garmin Training Readiness requires no ongoing subscription, making it the most cost-effective option for most home trainers who already own a compatible watch.
| Device | HRV Method | Sleep Staging | Subscription Cost | Approx. 2-Year TCO | Best For |
|---|---|---|---|---|---|
| Whoop 5.0 | PPG-based RMSSD, nightly | Proprietary algorithm | ~$199/year | ~$398 (subscription only; hardware included in membership) | Daily strain-to-recovery coaching; frequent trainers |
| Oura Ring Gen 4 | PPG-based RMSSD, nightly; highest validated accuracy (CCC 0.99) | ~91.7% accuracy vs. polysomnography | $5.99/month (~$72/year) | ~$444 ($300 hardware + ~$144 subscription) | Sleep-first recovery tracking; those prioritizing HRV accuracy |
| Garmin (compatible watch) | PPG-based, 7-day rolling HRV Status | Proprietary algorithm | $0 (no subscription required) | Watch purchase price only (varies by model) | No-subscription training readiness; most home trainers |
One practical finding worth anchoring here: absolute HRV numbers differ substantially across devices, but trend lines tend to align. A journalist who wore five trackers simultaneously for two weeks found that raw nightly HRV readings varied considerably device to device — but the week-over-week trajectory told the same story across all of them. The implication for home fitness users is straightforward: pick one device, use it consistently, and track your own trends. Switching devices mid-training block will reset your baseline and make the data temporarily uninterpretable.
Building a Personal HRV Baseline Before Any Number Is Actionable
A single HRV reading tells you almost nothing. This is not a limitation of your device — it's a fundamental property of the metric. HRV varies substantially day to day based on sleep position, room temperature, alcohol, stress, and dozens of other factors. Without a personal baseline, you have no reference point for whether today's reading is low, normal, or elevated for you specifically.
A 2026 narrative review published in the journal Sensors confirms that isolated recordings do not account for baseline HRV, which requires frequent measurements over at least a week to establish. The same review identifies a seminal finding: changes in weekly HRV average showed significantly stronger correlations with running performance (r = 0.72 and −0.76) compared to isolated single-day readings (r = −0.06 and −0.17). A single day's score had essentially no predictive value. Weekly trends had strong predictive value.
The two interpretive tools that actually matter are:
- Weekly RMSSD mean (RMSSDMEAN): Your average HRV across a full week. When this number trends upward over several weeks, it indicates positive training adaptation — your body is absorbing the work. When it trends downward over multiple weeks, it signals accumulated fatigue or insufficient recovery.
- Weekly RMSSD coefficient of variation (RMSSDCV): How much your HRV fluctuates day to day within a given week. High day-to-day variability (elevated CV) suggests your body is not in a stable recovery state — it's responding erratically to stress. Low, stable CV alongside a rising weekly mean is the signature of good adaptation.
In practice: wear your tracker for at least 7 consecutive nights before treating any reading as actionable. Most devices will begin generating a baseline automatically. After 2–4 weeks of consistent data, you'll have enough history to recognize what a genuinely suppressed reading looks like for you versus a normal day-to-day dip.
A Four-Signal Framework for Adjusting Your Home Workouts
Once you have a baseline, you need a decision rule — otherwise the data remains inert. The framework below is built on the research principle that multi-day trends, not single readings, are the valid input for training adjustments. One low day is noise. Two or three consecutive low days is a signal.
| Signal | What the Data Shows | Recommended Adjustment |
|---|---|---|
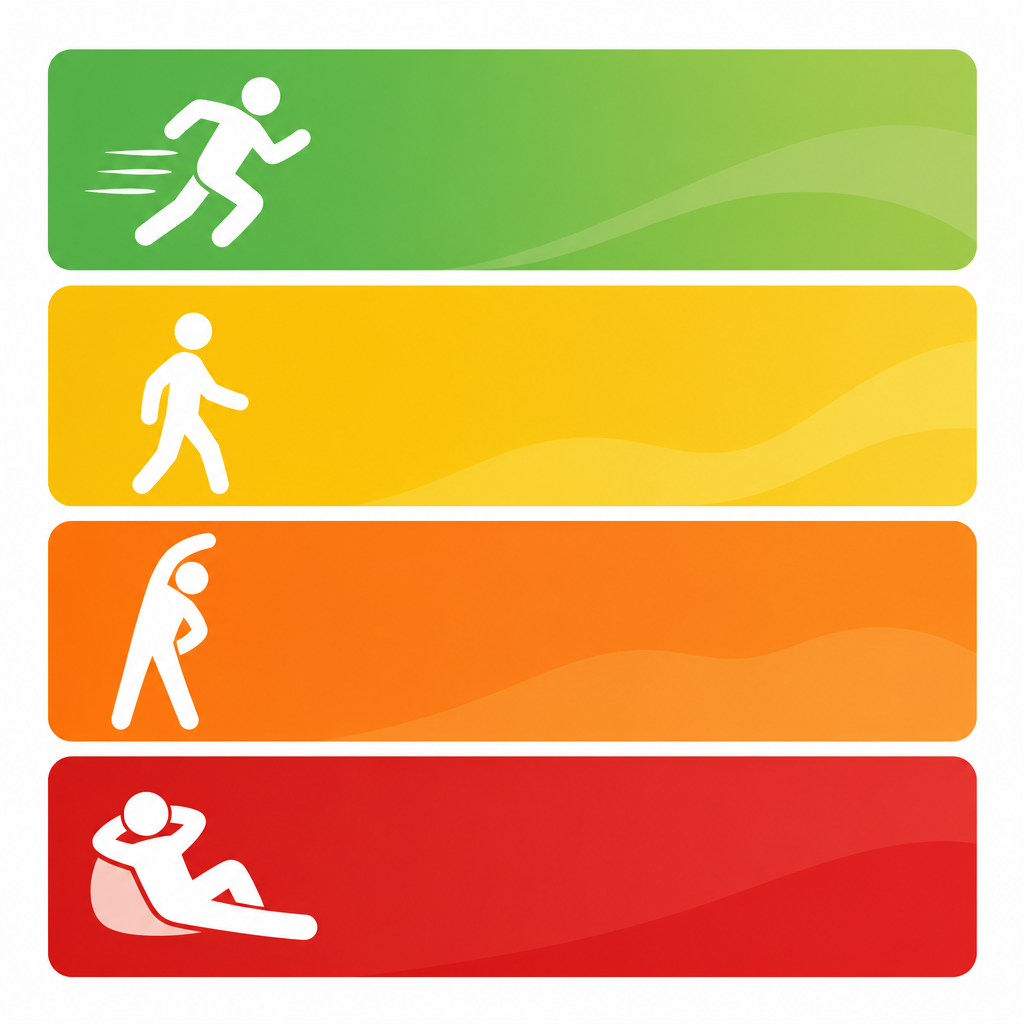
| Green | HRV at or above your weekly mean; readiness score in normal-to-high range for 2+ consecutive days | Train as planned. This is not the day to hold back unnecessarily. |
| Yellow | HRV 10–20% below your weekly mean; readiness score below your typical range for 1–2 days | Reduce planned volume or intensity by roughly 20%. Complete the session but don't push for a personal best. Prioritize sleep tonight. |
| Red | HRV more than 20% below your weekly mean; readiness score significantly suppressed; resting HR elevated | Active recovery only. Light walking, mobility work, foam rolling, or a full rest day. No structured training load. |
| Multi-day Red | HRV suppressed for 3 or more consecutive days without an obvious single-night explanation (illness, travel, alcohol) | Trigger a planned deload week. Reduce overall training volume by 40–60% for 5–7 days. This is not optional — it is the training stimulus that allows adaptation to catch up. |
A few practical notes on applying this framework at home:
- The Yellow signal is the most commonly ignored. Reducing intensity by 20% feels like undertraining. It isn't — it's the difference between absorbing a training block and accumulating fatigue that forces an unplanned break.
- The Red signal does not mean zero movement. Light walking and mobility work support recovery without adding training load. Staying completely sedentary is rarely the optimal Red-day response.
- Multi-day Red is the signal most home trainers miss because they're interpreting each day in isolation. Look at your weekly trend, not just today's number.
- Green does not mean maximum effort every time. It means your body is ready — not that you must maximize load. Sustainable training respects the full week's plan, not just today's readiness.
When to Ignore Your Tracker Entirely
There are days when your tracker's output is actively misleading — not because the device is malfunctioning, but because HRV responds to a wide range of stressors that have nothing to do with your training load.
Known confounders that suppress HRV without reflecting training fatigue:
- Alcohol — even moderate amounts significantly suppress nocturnal HRV, producing a Red or Yellow signal that reflects the alcohol, not your fitness state
- Illness — immune activation suppresses HRV; a low reading during a cold is not a training signal
- Travel and time zone changes — circadian disruption affects HRV for 2–5 days after crossing time zones
- Psychological stress — work deadlines, relationship stress, and anxiety all reduce HRV via the same autonomic pathways as physical training stress
- Poor sleep position or device fit — PPG sensors lose accuracy when contact is inconsistent, producing artifactually low readings
The research case for subjective feel as a cross-check is stronger than most tracker users realize. Professor Shona Halson — who led recovery programs across three Olympic campaigns — has stated that in her research, subjective reporting was the strongest predictor of athlete performance and fatigue, outperforming objective data:
A peer-reviewed study of elite NCAA Division 1 swimmers during a 6-week overload training period reinforces this. While WHOOP-derived HRV did correlate meaningfully with sport-specific stress, Strain and Recovery scores showed no significant relationship with validated metabolic stress markers or questionnaire-based recovery measures. The conclusion for home fitness users: proprietary scores are directional guides, not verdicts. They require cross-checking against how you actually feel.
General Wellness Disclaimer
Your Tracker Is One Input, Not the Final Word
A wearable activity tracker becomes genuinely useful when you understand what it's actually measuring, give it enough time to build a meaningful baseline, and apply its output as one signal among several — not as an autonomous verdict.
The most effective approach for a self-coached home fitness practitioner is to combine three inputs: your multi-day HRV trend, your resting heart rate pattern, and your honest subjective assessment of how you feel. When all three align — trending HRV, stable RHR, and a genuine sense of readiness — train as planned. When they conflict, the subjective signal is rarely wrong.
The goal is not to optimize your readiness score. The goal is to train consistently, recover adequately, and avoid the accumulated fatigue that forces unplanned breaks. Your tracker, used with the right framework, makes that easier. It doesn't make the decisions for you.
This is general fitness education, not medical advice. For diagnosis or treatment of pain or injury, consult a qualified clinician.
Pick your next session
Browse all routines to find an appropriately-spaced next session.
Spot something off?
This content sits adjacent to health guidance — tell us if a citation or figure needs a correction.