How Heart Rate Fitness Trackers Measure Recovery: HRV, Resting Heart Rate, and Heart Rate Recovery Explained
This article explains the three key recovery metrics your fitness tracker provides—resting heart rate, heart rate variability, and heart rate recovery—how wrist-based and chest-strap sensors capture them, and how to interpret the data to guide your training and recovery decisions.
Why Recovery Metrics Matter Beyond Workout Tracking
Most people strap on a heart rate fitness tracker to see how hard they worked during a session — peak heart rate, time in zone, calories burned. That data has its uses, but it only tells half the story. The more revealing information comes after the workout ends: how quickly your body returns to baseline, how well your nervous system is balancing stress and recovery, and whether you are actually adapting to the training load you are piling on.
Your tracker captures three distinct recovery metrics — resting heart rate (RHR), heart rate variability (HRV), and heart rate recovery (HRR) — each reflecting a different physiological process. Understanding what these numbers mean and how your device calculates them is the difference between glancing at a readiness score and actually knowing whether your body is ready for another hard session or needs a rest day.
Resting Heart Rate (RHR): What It Signals About Fitness and Recovery
Resting heart rate is exactly what it sounds like: the number of times your heart beats per minute when you are fully at rest — awake but not moving, sitting or lying down, and not digesting a large meal. Most trackers capture RHR during sleep, when movement is minimal and the reading is most consistent.
A lower RHR generally indicates better cardiovascular fitness. A stronger heart pumps more blood per beat, so it needs fewer beats per minute to maintain circulation. The typical adult range is 60 to 100 beats per minute, but regularly active people often sit between 40 and 60. Elite endurance athletes can dip into the 30s.
The real value of RHR as a recovery metric comes from trending it over time, not from a single reading. A gradual downward trend over weeks and months suggests your cardiovascular system is adapting to training. A sudden upward spike — 5 to 10 beats above your normal baseline — can signal several things: insufficient recovery, the onset of illness, dehydration, or accumulated training stress. If your tracker shows your RHR creeping up for three or more consecutive mornings, it is worth considering a lighter training day or an extra rest day.
Heart Rate Variability (HRV): The Autonomic Nervous System Connection
Heart rate variability is often misunderstood. It is not a measure of how fast your heart is beating, but of the variation in time between consecutive heartbeats. If your heart beats at 60 bpm, the interval between beats is not exactly one second every time — it fluctuates by milliseconds. More fluctuation (higher HRV) is generally a sign that your body is in a recovered, parasympathetic-dominant state. Less fluctuation (lower HRV) suggests your sympathetic nervous system — the fight-or-flight branch — is more active.
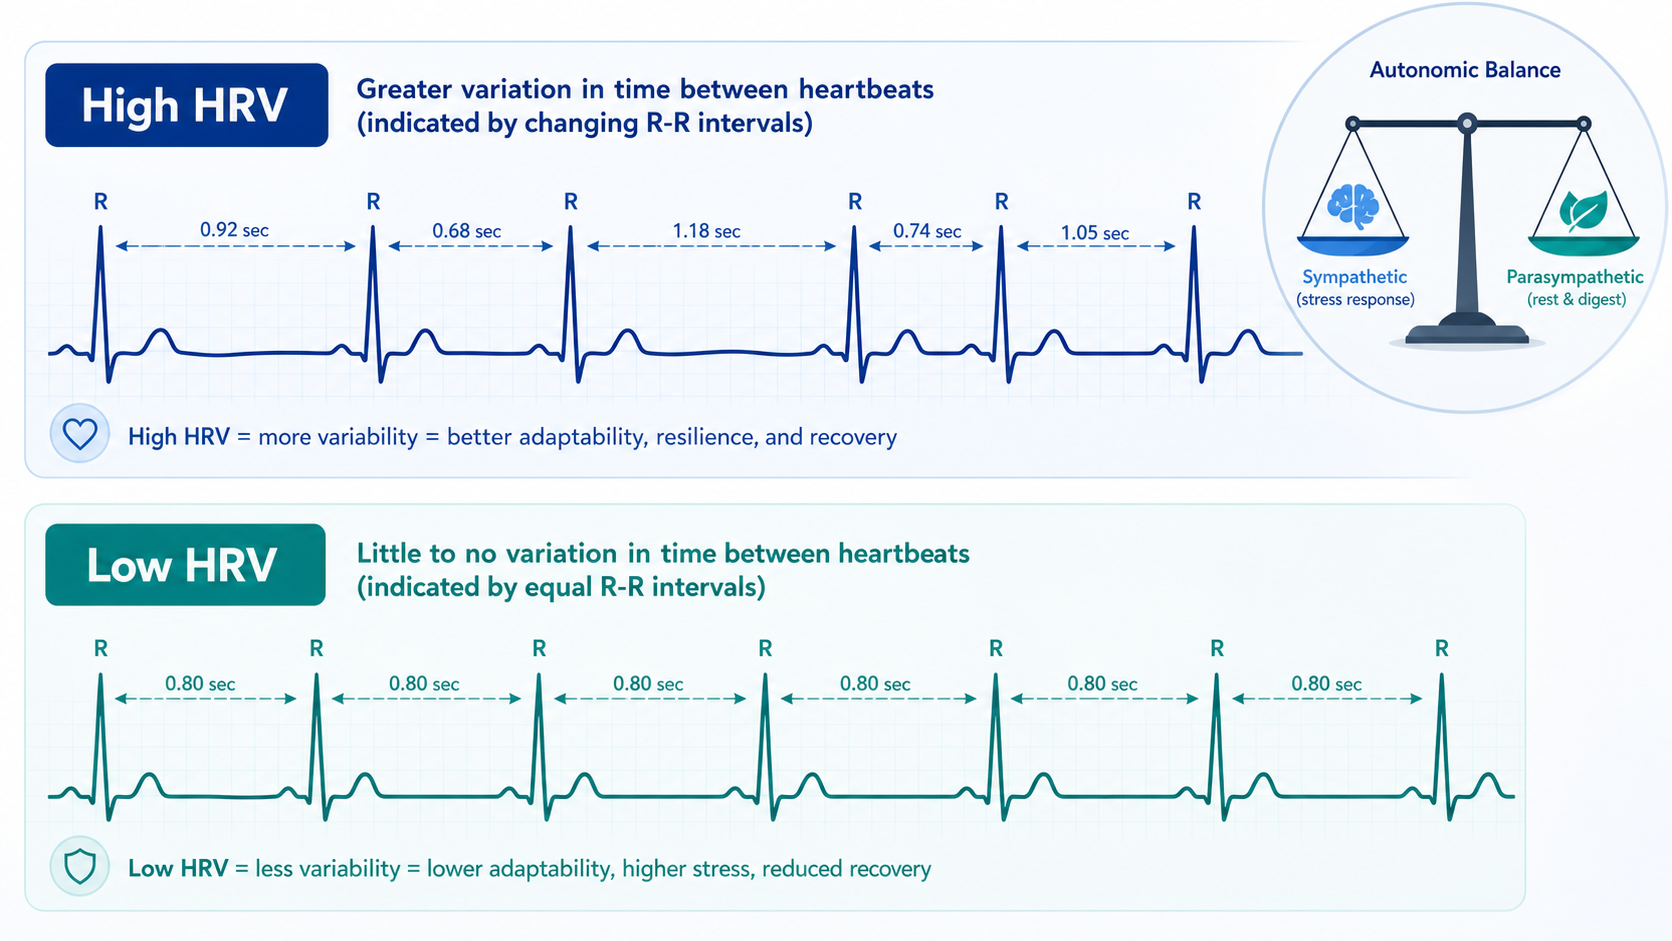
Trackers measure HRV by analyzing the R-R interval — the time between the R peaks of successive heartbeats on an ECG waveform. Wrist-based optical sensors can estimate this interval from the pulse wave, but the measurement is more reliable when taken during a consistent state, which is why most devices capture HRV during sleep or during a dedicated morning reading.
The Oura Ring 4 is widely cited as the most accurate wearable for HRV, based on independent studies. Whoop uses a proprietary strain-and-recovery model that leans heavily on HRV data, and Garmin's Body Battery feature integrates HRV alongside other inputs. The key point for the home fitness user: HRV is deeply individual. A "good" HRV for a 25-year-old runner may be 80 milliseconds, while a 50-year-old with the same fitness level might sit at 45. Do not compare your HRV to someone else's. Track your own trend.
Heart Rate Recovery (HRR): How Quickly Your Heart Returns to Baseline
Heart rate recovery measures the drop in your heart rate during the first one to two minutes after you stop exercising. It is calculated simply: peak heart rate during exercise minus heart rate one minute after stopping equals your HRR in beats per minute. A faster drop indicates a more responsive cardiovascular system and better recovery capacity.
Clinical guidelines from the Cleveland Clinic define a good HRR as 18 bpm or higher after one minute. A drop of less than 12 bpm in the first minute is considered abnormal and is flagged by both Cleveland Clinic and Garmin as a sign to consult a physician. Cleveland Clinic also notes that abnormal HRR is linked to a higher risk of cardiovascular mortality, even in people without diagnosed risk factors.
Empirical Health reports that the average heart rate recovery on Apple Watch is 26 bpm. For context, a recovery of 54 bpm puts you in the top 1%, while 21 bpm corresponds to the bottom quartile. Age and sex also matter: for people under 35, a recovery of 43 bpm puts them in the top 10%; for those 65 and older, the 90th percentile drops to 25 bpm for women and 19 bpm for men.
| HRR Drop (1 min) | What It Suggests |
|---|---|
| Less than 12 bpm | Abnormal — consult a physician per Cleveland Clinic and Garmin guidelines |
| 12–17 bpm | Below average but within normal range |
| 18–25 bpm | Good — typical for regularly active individuals |
| 26+ bpm | Excellent — average Apple Watch HRR is 26 bpm |
| 54+ bpm | Top 1% — exceptional recovery capacity |
This is general fitness education, not medical advice. For diagnosis or treatment of pain or injury, consult a qualified clinician.
Pick your next session
Browse all routines to find an appropriately-spaced next session.
Spot something off?
This content sits adjacent to health guidance — tell us if a citation or figure needs a correction.