Fitness Tracker Accuracy for Women: How Heart Rate, Step Count, Sleep, and Cycle Tracking Really Perform Across Top Models
A data-driven analysis of how accurately top fitness trackers measure heart rate, steps, sleep stages, and menstrual cycle data — with specific error rates from independent lab tests and clinical validation studies, so women know which metrics to trust and which to treat as directional.
Why Accuracy Matters Differently for Women
Fitness tracker marketing often treats accuracy as a solved problem. The reality is more complicated: wrist-based sensors have well-documented limitations, and those limitations don't affect all metrics — or all people — equally. For women, three specific factors make accuracy a more nuanced question than most reviews acknowledge.
First, cycle tracking is a women-specific feature that depends heavily on sensor fusion. A device that logs periods via calendar input is doing something fundamentally different from one that combines basal body temperature, heart rate variability, and movement data to estimate ovulation windows. The accuracy gap between these approaches is not small — it can shift ovulation detection from reliable to nearly random.
Second, sleep architecture differs across the menstrual cycle. Women tend to spend more time in deep sleep during the follicular phase and more time in REM during the luteal phase. A sleep staging algorithm trained predominantly on male sleep data may misclassify these shifts, producing stage distributions that look wrong even when the total sleep time is correct.
Third, the workout patterns common among women — HIIT classes, strength training, steady-state cardio — place different demands on optical heart rate sensors than the steady running used in most validation studies. A sensor that tracks a 10-minute mile accurately may struggle with the rapid heart rate changes in a 30-second burpee interval.
Heart Rate Accuracy: What Independent Lab Tests Reveal
Consumer PPG (photoplethysmography) sensors — the green or red lights on the back of your watch — have a documented error range of approximately ±5 BPM at rest and up to ±12 BPM during high-intensity intervals. That second figure matters because a 12 BPM error can shift you from what feels like a hard effort into what the tracker reports as a moderate one, or vice versa. Chest straps remain the gold standard for accuracy, but wrist-based sensors have improved significantly in recent generations.
The most rigorous independent testing comes from CNET's lab, which evaluated the Apple Watch Series 11 against a Polar H10 chest strap across more than 30 miles of combined testing. The Series 11 recorded an average heart rate error of 0.98%, or roughly 1.40 BPM — the lowest error rate CNET has measured in any wrist-worn device. That result earned the Series 11 a CNET Lab Award for most accurate heart rate monitor.
Forbes Vetted's testing of the Garmin Venu 3 found it was the tracker that came closest to the Polar H10 during strength training and light cardio — two activity types where wrist-based sensors often struggle because arm movement and muscle contraction can displace the optical sensor from the skin. The Fitbit Charge 6 also performed well in Forbes' testing, keeping up with rapid heart rate changes during high-intensity intervals that saw BPM drop from 160 to 120 within 30 to 60 seconds.
| Device | Test Source | Key Finding | Activity Context |
|---|---|---|---|
| Apple Watch Series 11 | CNET lab (30+ miles) | 0.98% avg. error (~1.40 BPM) vs. Polar H10 | Mixed running and walking |
| Garmin Venu 3 | Forbes Vetted | Closest to Polar H10 during strength and light cardio | Strength training, light cardio |
| Fitbit Charge 6 | Forbes Vetted | Tracked rapid BPM drops (160→120 in 30–60 sec) | High-intensity intervals |
| Withings ScanWatch Light | Forbes Vetted | Inconsistent heart rate tracking noted | General activity |
For a deeper look at how Apple Watch heart rate tracking performs across different conditions, see our Apple Watch fitness tracking accuracy analysis.
Step Count Accuracy: Which Devices Get It Right
Step counting is the most mature metric in consumer wearables, and it shows. Across devices, step count accuracy is generally excellent — far better than heart rate or sleep staging. The Wirecutter team tested step count accuracy against a validated research-grade pedometer over two full days of normal activity. The Fitbit Inspire 3 had the best result, with just 0.32% error. The Fitbit Charge 6 followed at 1.3% error. In a separate one-mile distance test, the Inspire 3 was over by only 0.03 miles.
These results make step count the one metric you can treat as essentially reliable across most modern trackers. The error rates are small enough that they don't meaningfully affect daily activity tracking or trend monitoring. Gender-specific gait differences — women tend to have shorter stride length and different foot strike patterns — can introduce small systematic biases, but the effect is typically within the 1–2% range and consistent enough that day-to-day trends remain valid.
| Device | Step Count Error | Distance Error (1 mile) | Test Method |
|---|---|---|---|
| Fitbit Inspire 3 | 0.32% | +0.03 miles | 2-day wear vs. validated pedometer |
| Fitbit Charge 6 | 1.3% | Not tested | 2-day wear vs. validated pedometer |
If step count is your primary metric, you can choose a device based on other priorities — battery life, display type, or comfort — without worrying about accuracy trade-offs. The Inspire 3's 0.32% error rate is essentially negligible for daily use.
Sleep Staging: The Wide Gap Between Lab-Grade and Wrist-Worn
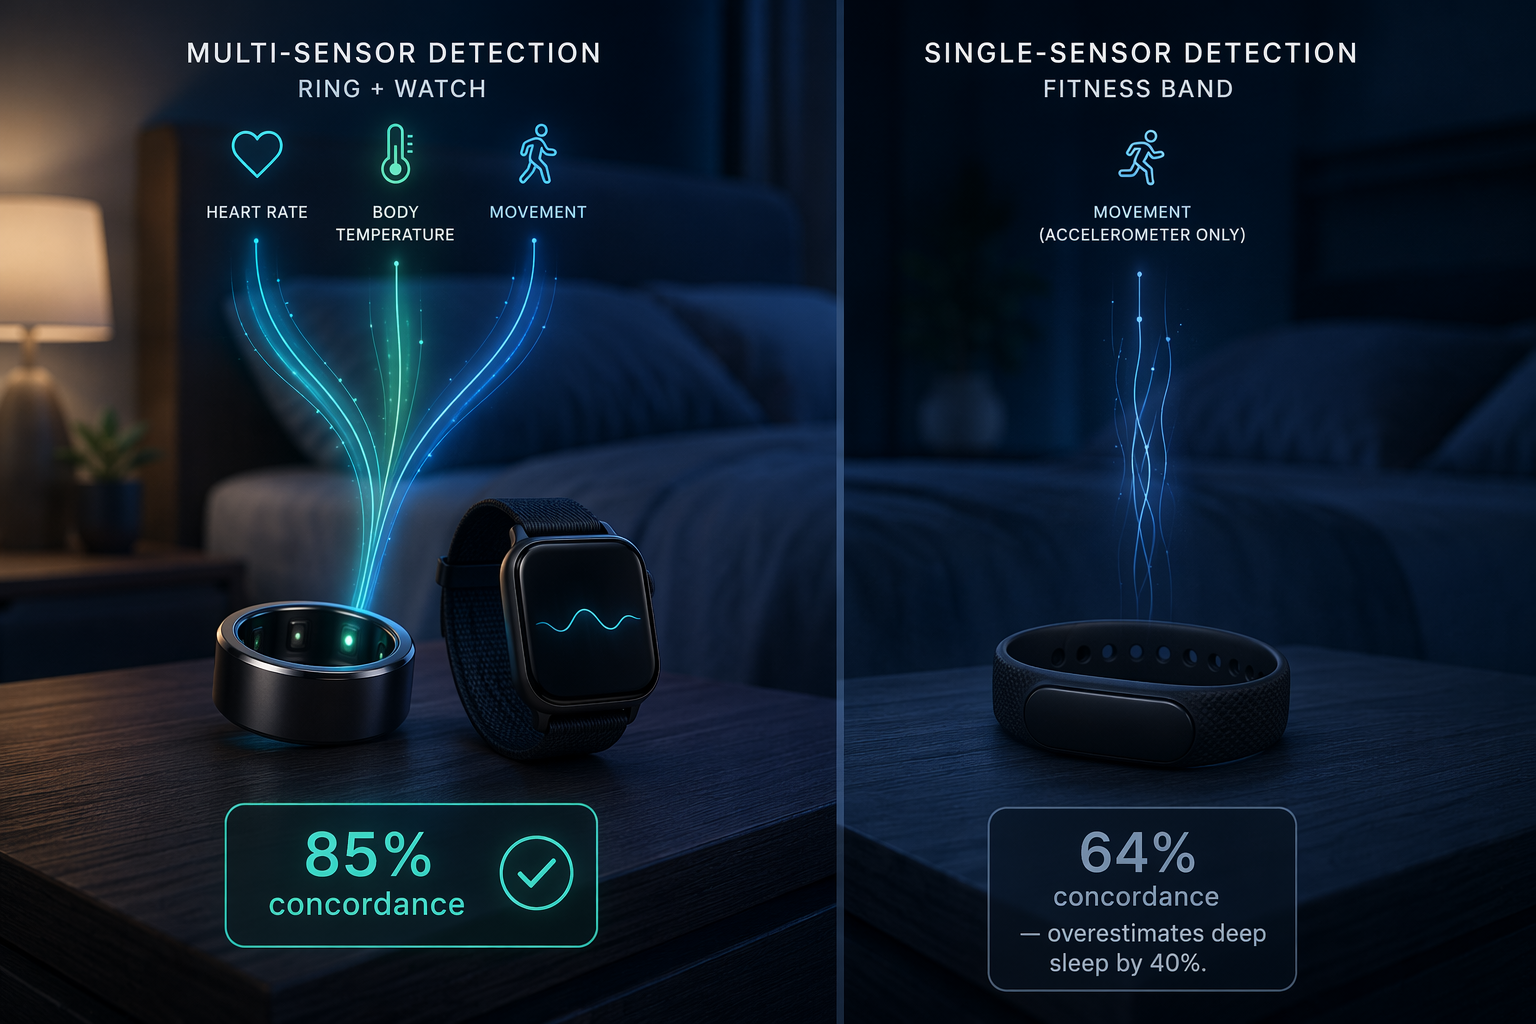
Sleep staging is where the accuracy gap between devices is widest — and where the difference between a multi-sensor device and a basic accelerometer tracker matters most. Polysomnography (PSG), the clinical gold standard, uses EEG, EOG, and EMG to classify sleep stages. Consumer wearables infer stages from proxy signals: movement, heart rate, heart rate variability, and in some cases, skin temperature.
The concordance rates against PSG tell a clear story. The Oura Ring 4 achieves approximately 85% agreement with PSG for sleep staging, making it the most accurate consumer sleep tracker currently available. The Withings ScanWatch Light, which combines PPG with ballistocardiography (BCG) — measuring subtle chest movements through the wrist — reaches about 82% concordance. The Garmin Venu 3S follows at 78%. At the lower end, the Fitbit Inspire 3, which relies primarily on an accelerometer, achieves only 64% concordance.
The practical consequence of low concordance is that single-sensor accelerometer-only trackers overestimate deep sleep by up to 40% compared to PSG. They mistake stillness for deep sleep, which means a night spent lying awake but motionless can be classified as deep sleep. For women, this error may be compounded by the natural sleep architecture shifts across the menstrual cycle — more deep sleep in the follicular phase, more REM in the luteal phase — which a movement-only algorithm cannot distinguish.
| Device | Sleep Staging Concordance vs. PSG | Sensor Type | Key Limitation |
|---|---|---|---|
| Oura Ring 4 | ~85% | PPG + temperature + accelerometer | Requires subscription for full data |
| Withings ScanWatch Light | ~82% | PPG + BCG | Inconsistent HR tracking reported |
| Garmin Venu 3S | ~78% | PPG + accelerometer | Lower concordance than ring-based devices |
| Fitbit Inspire 3 | ~64% | Accelerometer only | Overestimates deep sleep by up to 40% |
For a broader analysis of how Garmin devices handle sleep tracking and other metrics, see our Garmin fitness tracker accuracy deep dive.
Cycle Tracking: Where Accuracy Depends on Sensor Fusion
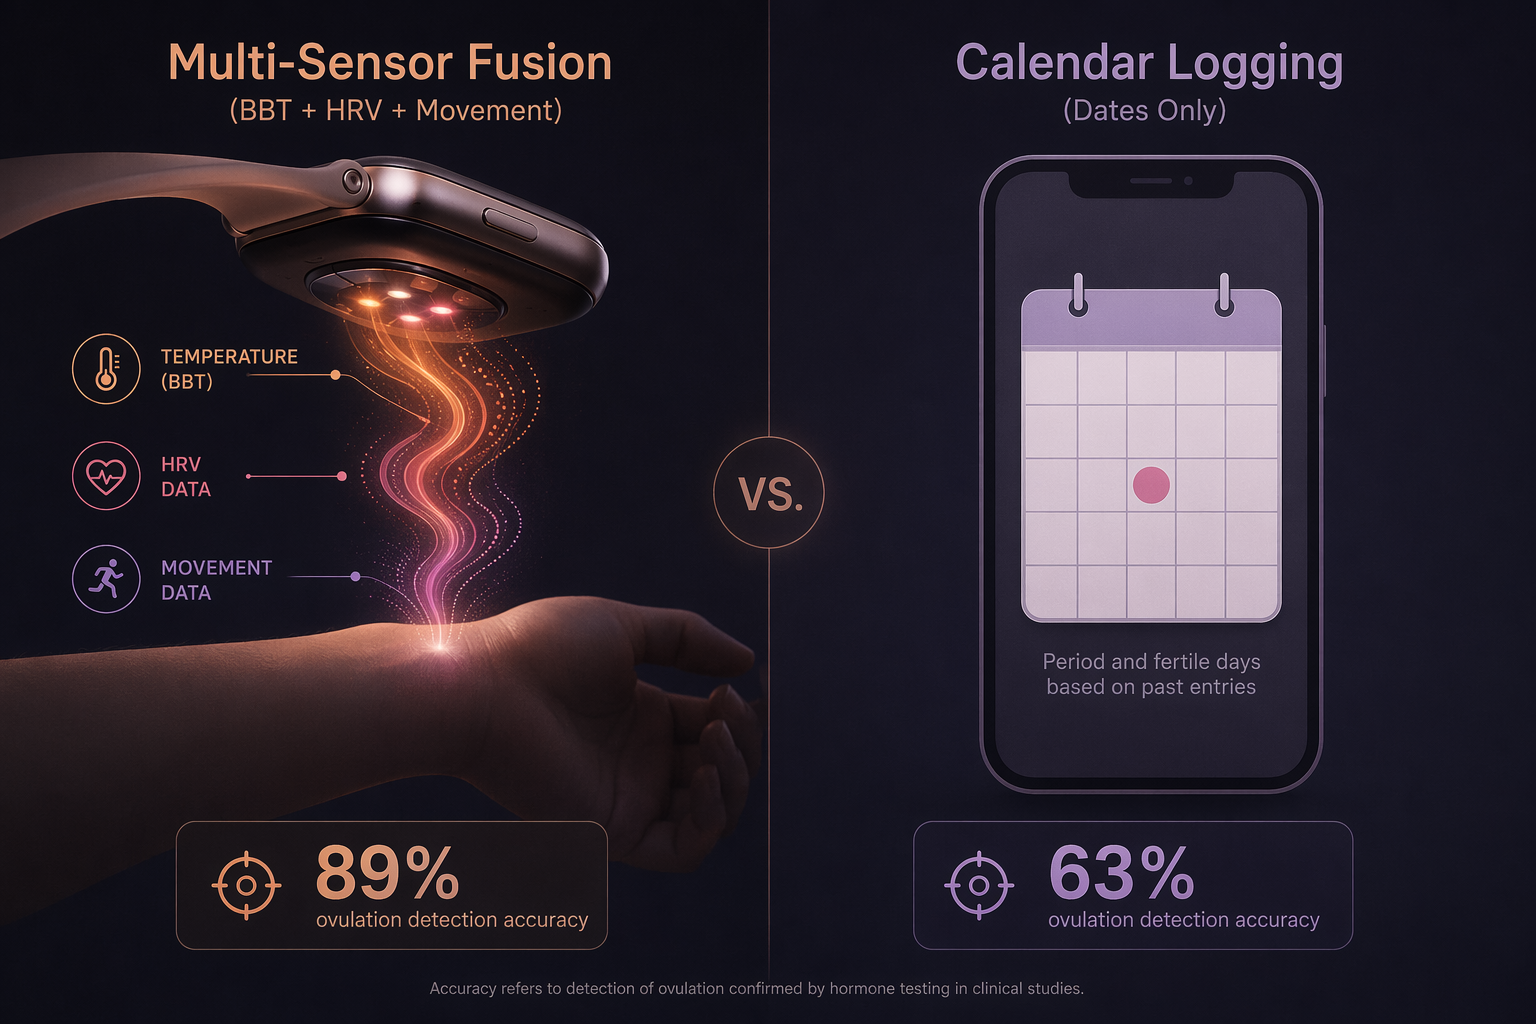
Cycle tracking accuracy is the area where the difference between a well-designed device and a basic one is largest — and where marketing claims are most likely to outpace the evidence. The critical variable is whether the device uses multi-sensor fusion (temperature + HRV + movement) or simple calendar logging.
The data makes this distinction stark. Without basal body temperature (BBT) integration, ovulation detection accuracy drops from 89% to 63%. That 26-point gap is the difference between a feature you can rely on for family planning and one that is essentially a random guess. Only 12% of FDA-cleared digital health devices include validated menstrual cycle prediction — meaning the vast majority of cycle tracking features on the market have not been clinically validated for the purpose users most care about.
Among devices that do use multi-sensor fusion, the Oura Ring 4 leads with approximately 89% luteal phase detection accuracy. The Garmin Lily 2's cycle tracking was validated in a 2025 clinical correlation study with gynecologists on ovulation window estimation, though the specific accuracy figures from that study were not available in the pre-crawled source material at the time of writing.
| Tracking Approach | Ovulation Detection Accuracy | Example Devices | Validation Status |
|---|---|---|---|
| Multi-sensor fusion (BBT + HRV + movement) | ~89% | Oura Ring 4, Garmin Lily 2 | Clinical validation studies exist |
| Calendar logging only | ~63% | Basic fitness bands, most smartwatches | No clinical validation for prediction |
| No cycle tracking | N/A | Basic step counters | N/A |
The practical takeaway: if cycle tracking matters to you, choose a device that measures basal body temperature and combines it with HRV and movement data. A device that only lets you log period start dates is not doing cycle tracking in any meaningful sense — it is doing calendar management.
Calories Burned: The Metric You Should Treat as Directional
Calorie estimation is the least accurate metric on every consumer wearable, and this limitation applies across all devices and all users. Wrist-worn trackers consistently overestimate energy expenditure during low-intensity activity and underestimate it during high-intensity intervals. The error is systematic, not random — it is baked into the estimation algorithms, which rely on generalized metabolic equations combined with heart rate and movement data.
This is not a women-specific issue, but it is important context for anyone using calorie data to guide nutrition decisions. If you are eating back calories burned during exercise based on your tracker's estimate, you may be overeating by a significant margin — or undereating, depending on the activity type. The error is large enough that it can meaningfully affect weight management outcomes.
Which Metrics to Trust — and Which to Take With a Grain of Salt
Based on the accuracy data presented in this article, here is a practical framework for interpreting each metric from any wrist-worn tracker:
- Step count: Trust it. Error rates below 2% across tested devices make this the most reliable metric. Use it for daily activity targets and trend tracking without concern.
- Resting heart rate: Trust it. The ±5 BPM error at rest is small enough that week-over-week trends are meaningful. A rising resting heart rate over several days is a legitimate recovery signal.
- Heart rate during exercise: Trust trends, not absolute numbers. The ±12 BPM error during high-intensity intervals means individual readings may be off, but the shape of your heart rate curve — when it rises, how fast it recovers — is still useful.
- Sleep staging: Trust it only on multi-sensor devices. If your tracker uses only an accelerometer, treat sleep stage data as entertainment, not science. Devices with temperature and HRV sensors (Oura Ring, Withings ScanWatch, higher-end Garmin models) provide directionally useful staging.
- Cycle tracking: Trust it only with BBT integration. Calendar-logging-only features do not provide reliable ovulation detection. Multi-sensor devices with temperature sensing can be useful, but should not replace clinical methods for pregnancy planning.
- Calories burned: Do not trust it. Use it as a rough directional trend at most. Never base nutrition decisions on a wearable's calorie estimate.
For a broader look at how accuracy testing works across all tracker categories and what the data actually shows, see our metric-by-metric accuracy deep dive.
This result comes from one real apartment under the stated conditions — it is a strong signal, not a guarantee your space will measure identically.
Builds this evidence supports
No build currently links to this specific test. Browse all builds with a matching tag.
Spot something off?
If this result didn't match your own space, let us know — floor-damage and noise claims carry real deposit-risk consequences if we get them wrong.