Which Smart Watch Actually Tracks Recovery Well? HRV, Readiness Scores, and Training Load Compared
Not all wearables measure recovery the same way. This guide compares how smartwatches, smart rings, and screenless bands handle HRV, sleep staging, and training readiness — with accuracy data from 17 studies — so you can choose the right device for the metrics that matter most to you.
Why Recovery Tracking Is the New Battleground in Fitness Wearables
The global fitness tracker market is projected to reach $77.7 billion in 2026, with an estimated 462.65 million wristwear users worldwide, according to data from Market.us. Within that crowded field, step counting and calorie burn estimates have become table stakes — every device does them, and none does them perfectly. The feature that now separates premium wearables from commodity trackers is recovery: the ability to measure how well your body has recovered from training and whether you are ready to push hard again.
Recovery tracking is harder to implement than basic activity logging. It requires accurate overnight heart rate variability (HRV) measurement, reliable sleep staging, and algorithms that can distinguish between a bad night of sleep and an actual training adaptation deficit. Different manufacturers have made different trade-offs in sensor hardware, wearability, and algorithmic transparency. The result is a market where no single device wins across all recovery metrics — and the device that gives you the best sleep data may be the worst choice for tracking your actual workout.
This guide compares how smartwatches, smart rings, and screenless bands handle the four key recovery metrics — HRV, resting heart rate, sleep staging, and training load — using accuracy data from a comprehensive analysis of 17 peer-reviewed studies published between 2024 and 2025. The goal is not to declare a single winner but to help you match a device to the metric that matters most for your training.
How Smartwatches Measure Recovery: HRV, Resting Heart Rate, Sleep Staging, and Training Load
Before comparing devices, it helps to understand what each recovery metric actually measures and how wearables capture it. The underlying sensor technology is similar across most devices — optical photoplethysmography (PPG) sensors for heart rate, accelerometers for movement — but the algorithms that convert raw sensor data into recovery scores differ substantially between manufacturers.
- Heart Rate Variability (HRV): The variation in time between consecutive heartbeats. Higher HRV generally indicates a more resilient, recovered nervous system; lower HRV suggests stress, fatigue, or incomplete recovery. Wearables measure HRV during sleep using PPG sensors, typically capturing a 5-minute window during deep sleep or NREM stages. Nocturnal HRV is the most reliable consumer-grade measurement because movement artifacts are minimal.
- Resting Heart Rate (RHR): Your heart rate when you are fully at rest, typically measured during sleep or immediately upon waking. A lower RHR over time suggests improved cardiovascular fitness; an elevated RHR relative to your baseline can indicate incomplete recovery, illness, or accumulated fatigue. All wrist-worn devices achieve 97–99% accuracy for resting HR, making this the least differentiating metric across devices.
- Sleep Staging: The classification of sleep into light, deep, and REM stages using a combination of heart rate data and movement. This is the most algorithm-dependent metric. A critical limitation across all consumer wearables is that they systematically misclassify wake, deep sleep, and REM as light sleep — a conservative bias built into the algorithms to avoid over-reporting deep sleep. Total sleep time is more reliable than stage breakdown on any device.
- Training Load and Readiness: Proprietary scores that combine HRV, RHR, sleep data, and recent training history into a single readiness or recovery number. Garmin calls this Body Battery and Training Readiness, Whoop uses a Recovery score, Oura has a Readiness Score, and Apple Watch now offers Training Load. These scores are useful trend indicators but are not directly comparable between brands because each company uses a different algorithm and weighting system.
Accuracy Showdown: Which Device Wins by Metric
The following table summarizes the best available accuracy data for each recovery metric across the major wearable platforms. These figures are drawn from multiple independent studies and should be interpreted as cross-study comparisons rather than head-to-head results — no single validation study has tested all 2026 flagship devices in a unified protocol.
| Metric | Best Performing Device | Accuracy / Error | Study Details |
|---|---|---|---|
| Nocturnal HRV | Oura Gen 4 | CCC 0.99 (MAPE 5.96%) | Dial et al. 2025, 13 participants, 536 nights |
| Nocturnal HRV | Whoop 4.0 | CCC 0.94 (MAPE 8.17%) | Same study as above |
| Nocturnal HRV | Garmin Fenix 6 | CCC 0.87 (MAPE 10.52%) | Same study as above |
| Resting HR | Oura Gen 4 | CCC 0.98 | Same study as above |
| Active HR | Apple Watch | 86.31% correlation vs. ECG | Independent validation study |
| VO2 max | Garmin Fenix 6 | MAPE 5.7–7.05% | Independent validation study |
| VO2 max | Apple Watch | MAPE 13–16% | Independent validation study |
| Sleep staging (independent) | Apple Watch | κ = 0.53 | University of Antwerp study |
| Sleep staging (independent) | Garmin | κ = 0.21 | University of Antwerp study |
| Sleep staging (Oura-funded) | Oura Ring | κ = 0.65 | Brigham and Women's Hospital study |
| Deep sleep detection | Whoop | 69.6% accuracy | Independent validation study |
| Step accuracy | Garmin | 82.58% | Independent validation study |
| Step accuracy | Apple Watch | 81.07% | Independent validation study |
| Step accuracy | Fitbit | 77.29% | Independent validation study |
| Step accuracy | Oura Ring | 50.3% error (real-world) | Independent validation study |
| Calorie estimation | Apple Watch | 71% accuracy | Independent validation study |
| Calorie estimation | Garmin | 48% accuracy | Independent validation study |
Several patterns emerge from this data. Oura dominates nocturnal HRV and resting HR measurement, which are the foundation of any recovery score. Apple Watch leads in active HR accuracy and sleep staging among smartwatches. Garmin is the clear winner for VO2 max estimation and step accuracy but has the weakest sleep staging of any major platform. Whoop's deep sleep detection leads the field, and its new 5.0 hardware addresses a prior gap in muscular strain detection by adding onboard accelerometer-based set recognition.
Garmin: Body Battery, Training Readiness, and Recovery Time
Garmin's recovery tracking ecosystem is the most comprehensive among sport-focused smartwatches. The Body Battery metric combines HRV, stress levels, and activity data into a single 0–100 energy reserve score. Training Readiness adds sleep quality and recovery history to produce a daily readiness recommendation. Recovery Time estimates how many hours you need before your body can handle another high-intensity session.
Garmin's strength is integration with training load. If you follow structured workouts on a Garmin watch, the recovery metrics are contextualized against your actual training stress — not just overnight data. The Venu 3 adds nap detection and skin temperature sensing, which improves sleep context. However, the accuracy data reveals a significant weakness: Garmin's sleep staging (κ = 0.21) is the worst among major platforms in independent testing. If sleep stage breakdown is your primary concern, Garmin is not the right choice.
- Best for: Athletes who train with structured workouts and want recovery metrics tied to actual training load. Home gym users who follow Garmin Coach plans or structured strength programs will find the Recovery Time and Training Readiness features directly actionable.
- Weakness: Sleep staging accuracy. If you rely on deep sleep and REM percentages to gauge recovery quality, Garmin's data will be less reliable than Apple Watch or Oura.
- Models to consider: The Fenix 8 and Forerunner 570 are the current flagships. For a detailed model-by-model breakdown for home gym use, see our Best Garmin Fitness Tracker for Home Gym Users guide.
Apple Watch: Vitals App, Training Load, and Third-Party Recovery Tools
Apple Watch has historically been weaker than dedicated fitness brands on recovery metrics, but the introduction of the Vitals app and native Training Load in watchOS 11 changed that. The Vitals app surfaces overnight HRV, RHR, and respiratory rate in a single dashboard, flagging values that fall outside your personal baseline. Training Load calculates effort based on heart rate data and provides a 7-day trend view.
Apple Watch's accuracy profile is strong where it matters most for recovery: active HR (86.31% correlation with ECG) and sleep staging (κ = 0.53 in independent testing, the best among smartwatches). The VO2 max estimation is weaker than Garmin (MAPE 13–16% vs. 5.7–7.05%), but for most home fitness users, VO2 max is a secondary metric.
The real advantage of Apple Watch is the third-party app ecosystem. Apps like Bevel and Athlytic pull Apple Watch's raw HRV and sleep data and apply readiness algorithms similar to Whoop and Oura. This gives you the option of a recovery score without switching hardware. The trade-off is battery life: most Apple Watch models need daily charging, which means you must choose between overnight sleep tracking and daytime use. A common workaround is to charge during a morning shower and evening downtime.
- Best for: Users who want the best smartwatch sleep staging and active HR accuracy, and are willing to use third-party apps for readiness scoring. iPhone users who value ecosystem integration.
- Weakness: Battery life limits overnight wear compliance. The native Training Load feature is newer and less validated than Garmin's or Whoop's equivalents.
Whoop: The Strain/Recovery Model and Sleep Debt Tracking
Whoop takes a fundamentally different approach from smartwatches. It is a screenless band designed for 24/7 wear, with no display, no notifications, and no attempt to replace your phone. The entire product is built around the Strain/Recovery model: a daily Strain score based on heart rate during exercise and a Recovery score based on overnight HRV, RHR, and sleep quality.
Whoop's accuracy for nocturnal HRV is strong (CCC 0.94, MAPE 8.17%), placing it between Oura and Garmin. Its deep sleep detection leads all tested devices at 69.6% accuracy. The Sleep Debt feature tracks cumulative sleep deficit across multiple nights, which is useful for athletes who travel or have irregular schedules. The new Whoop 5.0 hardware addresses a prior criticism — poor muscular strain detection — by adding an onboard accelerometer that can recognize set starts and stops during strength training.
The subscription model ($30/month or $239/year) is a significant consideration. Whoop has no upfront hardware cost, but the ongoing fee makes it more expensive than a smartwatch over a 2–3 year period. For users who want recovery data without wearing a screen to sleep, Whoop's form factor is ideal — but you lose GPS, music control, and all smartwatch features.
- Best for: Recovery-focused athletes who want the best overnight HRV and deep sleep data without wearing a smartwatch. Users who are comfortable with a subscription model and do not need on-wrist workout tracking.
- Weakness: Subscription cost adds up over time. No display means you need your phone for any data check. Less useful for users who want a single device for both recovery and daily smartwatch functions.
Oura Ring: The Gold Standard for Overnight Recovery Data
Oura Ring is not a smartwatch, but it is the benchmark against which all other wearables are measured for overnight recovery data. The Gen 4 ring achieves a concordance correlation coefficient of 0.99 for nocturnal HRV — the highest of any consumer wearable tested in the Dial et al. 2025 study. Resting HR accuracy is similarly excellent at CCC 0.98. Sleep staging in the Oura-funded Brigham and Women's Hospital study reached κ = 0.65, the highest reported for any consumer device.
The form factor is the key advantage. Approximately 98% of users wear their Oura Ring consistently overnight, compared to 67% for smartwatches, according to data cited in the Lifehacker analysis. This compliance gap matters because recovery tracking requires consistent overnight data — a device you take off to charge or because it is uncomfortable to sleep in produces gaps in your HRV and sleep history.
| Metric | Oura Gen 4 | Whoop 4.0 | Garmin Fenix 6 | Apple Watch |
|---|---|---|---|---|
| Nocturnal HRV (CCC) | 0.99 | 0.94 | 0.87 | Not tested in this study |
| Resting HR (CCC) | 0.98 | Not tested | Not tested | Not tested |
| Sleep staging (κ) | 0.65 (Oura-funded) | Not tested | 0.21 (independent) | 0.53 (independent) |
| Deep sleep detection | Not tested | 69.6% | Not tested | Not tested |
| Step accuracy | 50.3% error | Not tested | 82.58% | 81.07% |
| Active HR accuracy | Not designed for this | Not tested | Not tested | 86.31% |
| Overnight wear compliance | ~98% | ~95% (estimated) | ~67% | ~67% |
Oura's weakness is active workout tracking. Step counting has a real-world error rate of 50.3%, making it unreliable for distance-based activities. The ring cannot measure active HR during exercise with the same accuracy as a wrist-based optical sensor. Oura is best understood as a recovery-first device that complements — rather than replaces — a smartwatch or fitness band for workout tracking. For a deeper dive into ring-only recovery tracking, see our guide on How Fitness Tracker Rings Measure Recovery.
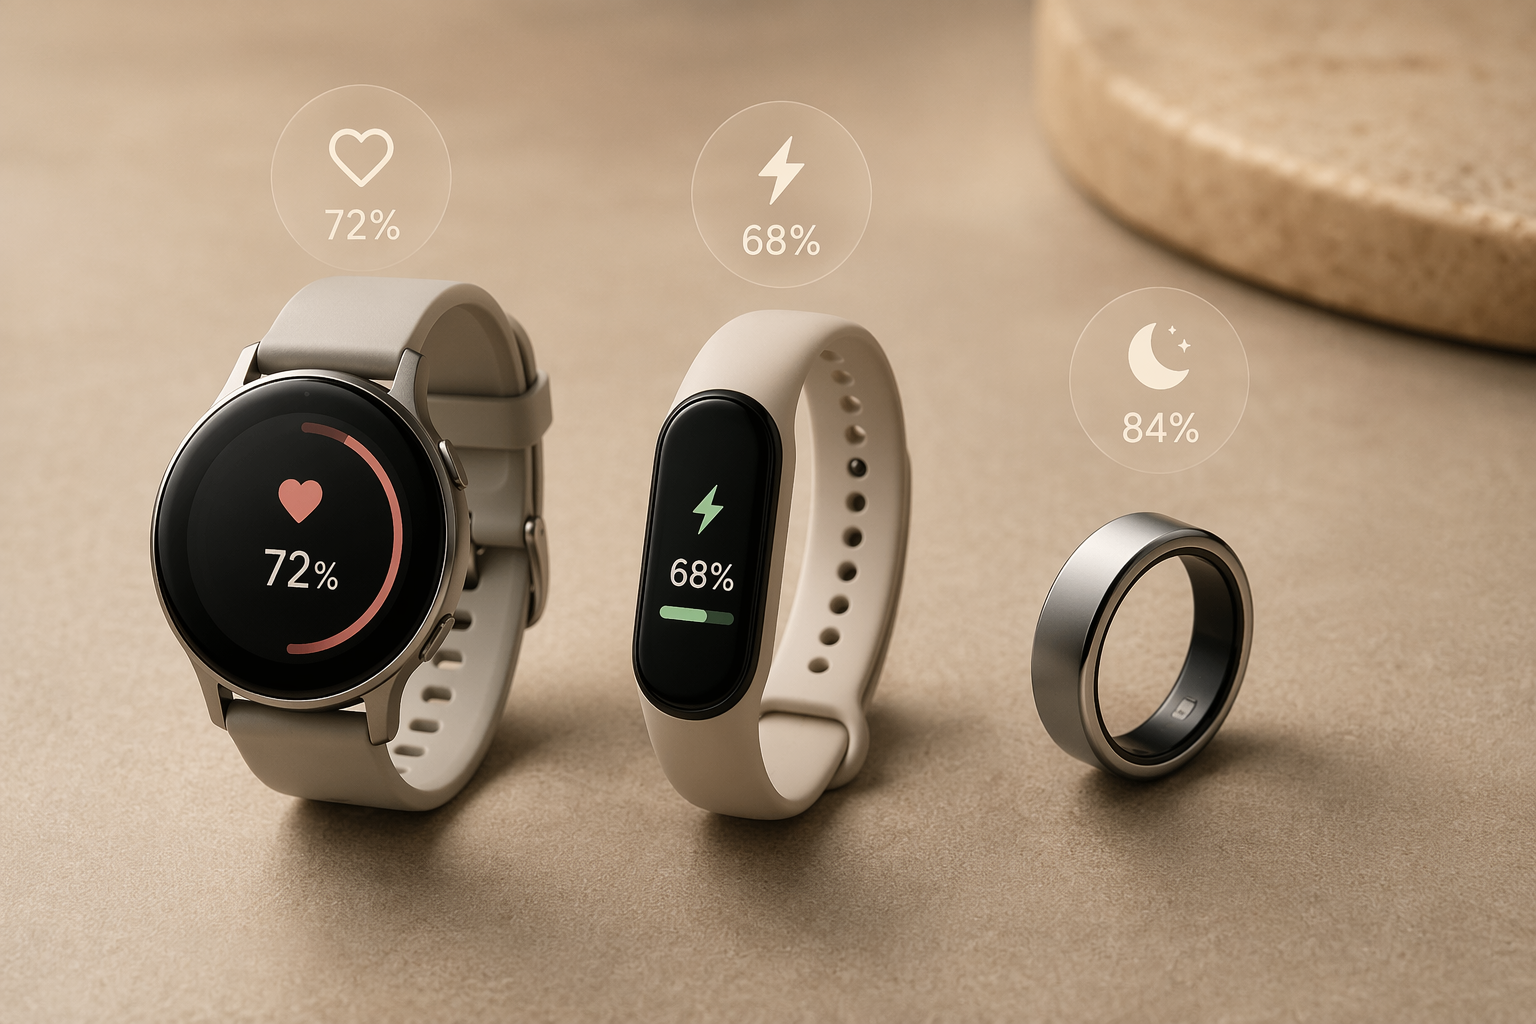
Smartwatch vs. Smart Ring vs. Screenless Band: The Trade-Off Matrix
The form factor you choose determines which recovery metrics you get good data on and which you sacrifice. The following matrix summarizes the trade-offs across the three device types.
| Dimension | Smartwatch (Garmin, Apple) | Smart Ring (Oura) | Screenless Band (Whoop) |
|---|---|---|---|
| Overnight HRV accuracy | Good (Garmin CCC 0.87) | Excellent (CCC 0.99) | Very good (CCC 0.94) |
| Sleep staging accuracy | Variable (Apple κ=0.53, Garmin κ=0.21) | Best reported (κ=0.65) | Deep sleep leader (69.6%) |
| Active HR accuracy | Excellent (Apple 86.3%) | Poor — not designed for this | Good — band form factor |
| VO2 max estimation | Excellent (Garmin MAPE 5.7%) | Not available | Not available |
| Step accuracy | Excellent (82–83%) | Poor (50% error) | Good (estimated ~80%) |
| Battery life | 18h–14 days (varies by model) | 4–7 days | 4–5 days |
| Overnight wear compliance | ~67% | ~98% | ~95% |
| Workout tracking | Full-featured (GPS, structured workouts) | Minimal | Heart-rate based only |
| Subscription required | No (except some Garmin features) | $5.99/month | $30/month |
| Display | Yes — full smartwatch functions | No | No |
How to Choose a Device Based on What You Actually Track
The right device depends on which recovery metric you prioritize and how you train. The following scenarios can help you narrow the field.
- You prioritize nocturnal HRV and sleep quality above all else: Choose Oura Ring. No other consumer device matches its HRV accuracy (CCC 0.99) or overnight wear compliance (98%). Accept that you will need a separate device or phone-based logging for workout tracking.
- You want the best sleep staging from a smartwatch: Choose Apple Watch. Its independent sleep staging accuracy (κ = 0.53) leads all smartwatches. Pair it with a third-party app like Bevel or Athlytic for a readiness score. Be prepared for daily charging.
- You are a structured athlete who wants recovery tied to training load: Choose Garmin. Body Battery and Training Readiness are contextualized against your actual workouts. The VO2 max estimation (MAPE 5.7–7.05%) is the best in the industry. Accept that sleep staging will be less reliable than Apple Watch or Oura.
- You want recovery data without wearing a screen to sleep: Choose Whoop. The screenless band is comfortable for 24/7 wear, and the Strain/Recovery model is well-validated. The subscription cost is the main downside. For a no-subscription screenless option, see our guide to Screenless Fitness Trackers Without a Subscription.
- You are a home gym user who wants one device for everything: Consider a Garmin Forerunner or Fenix series watch. It handles strength training logging, cardio machine tracking, and recovery metrics in a single device. For a broader comparison of home gym tracker options, see our Best Fitness Trackers for Home Gym Users guide.
Important Caveats: Study Funding, Device Generations, and What We Still Don't Know
The accuracy data in this guide is the best available as of mid-2026, but it comes with important limitations that affect how confidently you can apply these conclusions to current devices.
- Study funding matters. The Oura sleep staging data (κ = 0.65) comes from a study funded by Oura. While the study was conducted at Brigham and Women's Hospital and published in a peer-reviewed journal, funded studies tend to report more favorable results. The independent University of Antwerp study, which tested Apple Watch and Garmin, had no device manufacturer funding.
- Device generations are not equal. The Garmin Fenix 6 tested in the Kygo analysis is two or more generations old. The current Fenix 8 and Forerunner 570 use newer optical sensors and algorithms. Similarly, the Whoop 4.0 data may not fully represent Whoop 5.0 performance, which includes hardware improvements for muscular strain detection.
- No unified head-to-head study exists. No independent large-scale validation study has tested the 2026 flagship devices (Fenix 8, Whoop 5.0, Apple Watch Series 11, Oura Ring 4) against each other in a single protocol. All comparisons in this guide are cross-study comparisons, which introduce methodological differences that can affect results.
- All wearables estimate. Consumer wearables are not medical devices. They use optical sensors and algorithms to estimate physiological metrics, not measure them directly. The systematic misclassification of sleep stages — where all devices label wake, deep sleep, and REM as light sleep — is a conservative algorithmic choice, not a bug. Total sleep time is more reliable than stage breakdown on any device.
The wearable market moves quickly. Sensor hardware improves, algorithms get updated, and new form factors emerge. The core thesis of this guide — that no single device wins across all recovery metrics — is likely to remain true for the foreseeable future because the trade-offs between overnight comfort, active accuracy, battery life, and form factor are fundamental engineering constraints. The best approach is to identify the metric that matters most for your training and choose the device that optimizes for it, rather than searching for a single device that does everything well.
This is general fitness education, not medical advice. For diagnosis or treatment of pain or injury, consult a qualified clinician.
Pick your next session
Browse all routines to find an appropriately-spaced next session.
Spot something off?
This content sits adjacent to health guidance — tell us if a citation or figure needs a correction.