
The awkward part of Oura Ring vs WHOOP for recovery tracking is not that one device always looks wrong. It is that both can look plausible until they disagree on the same morning. In one Sportsmith analysis, a person wearing both devices at the same time woke up to an Oura Readiness score of 95% and a WHOOP Recovery score of 42%, while the two score series correlated at only r=0.41 across the test period.[1]
That is not a small rounding error. It is the difference between “go train” and “maybe back off,” which matters if the decision is happening at 6 a.m. before a garage workout. The tempting reaction is to declare one tracker more accurate and move on. The better question is more specific: accurate at what level?
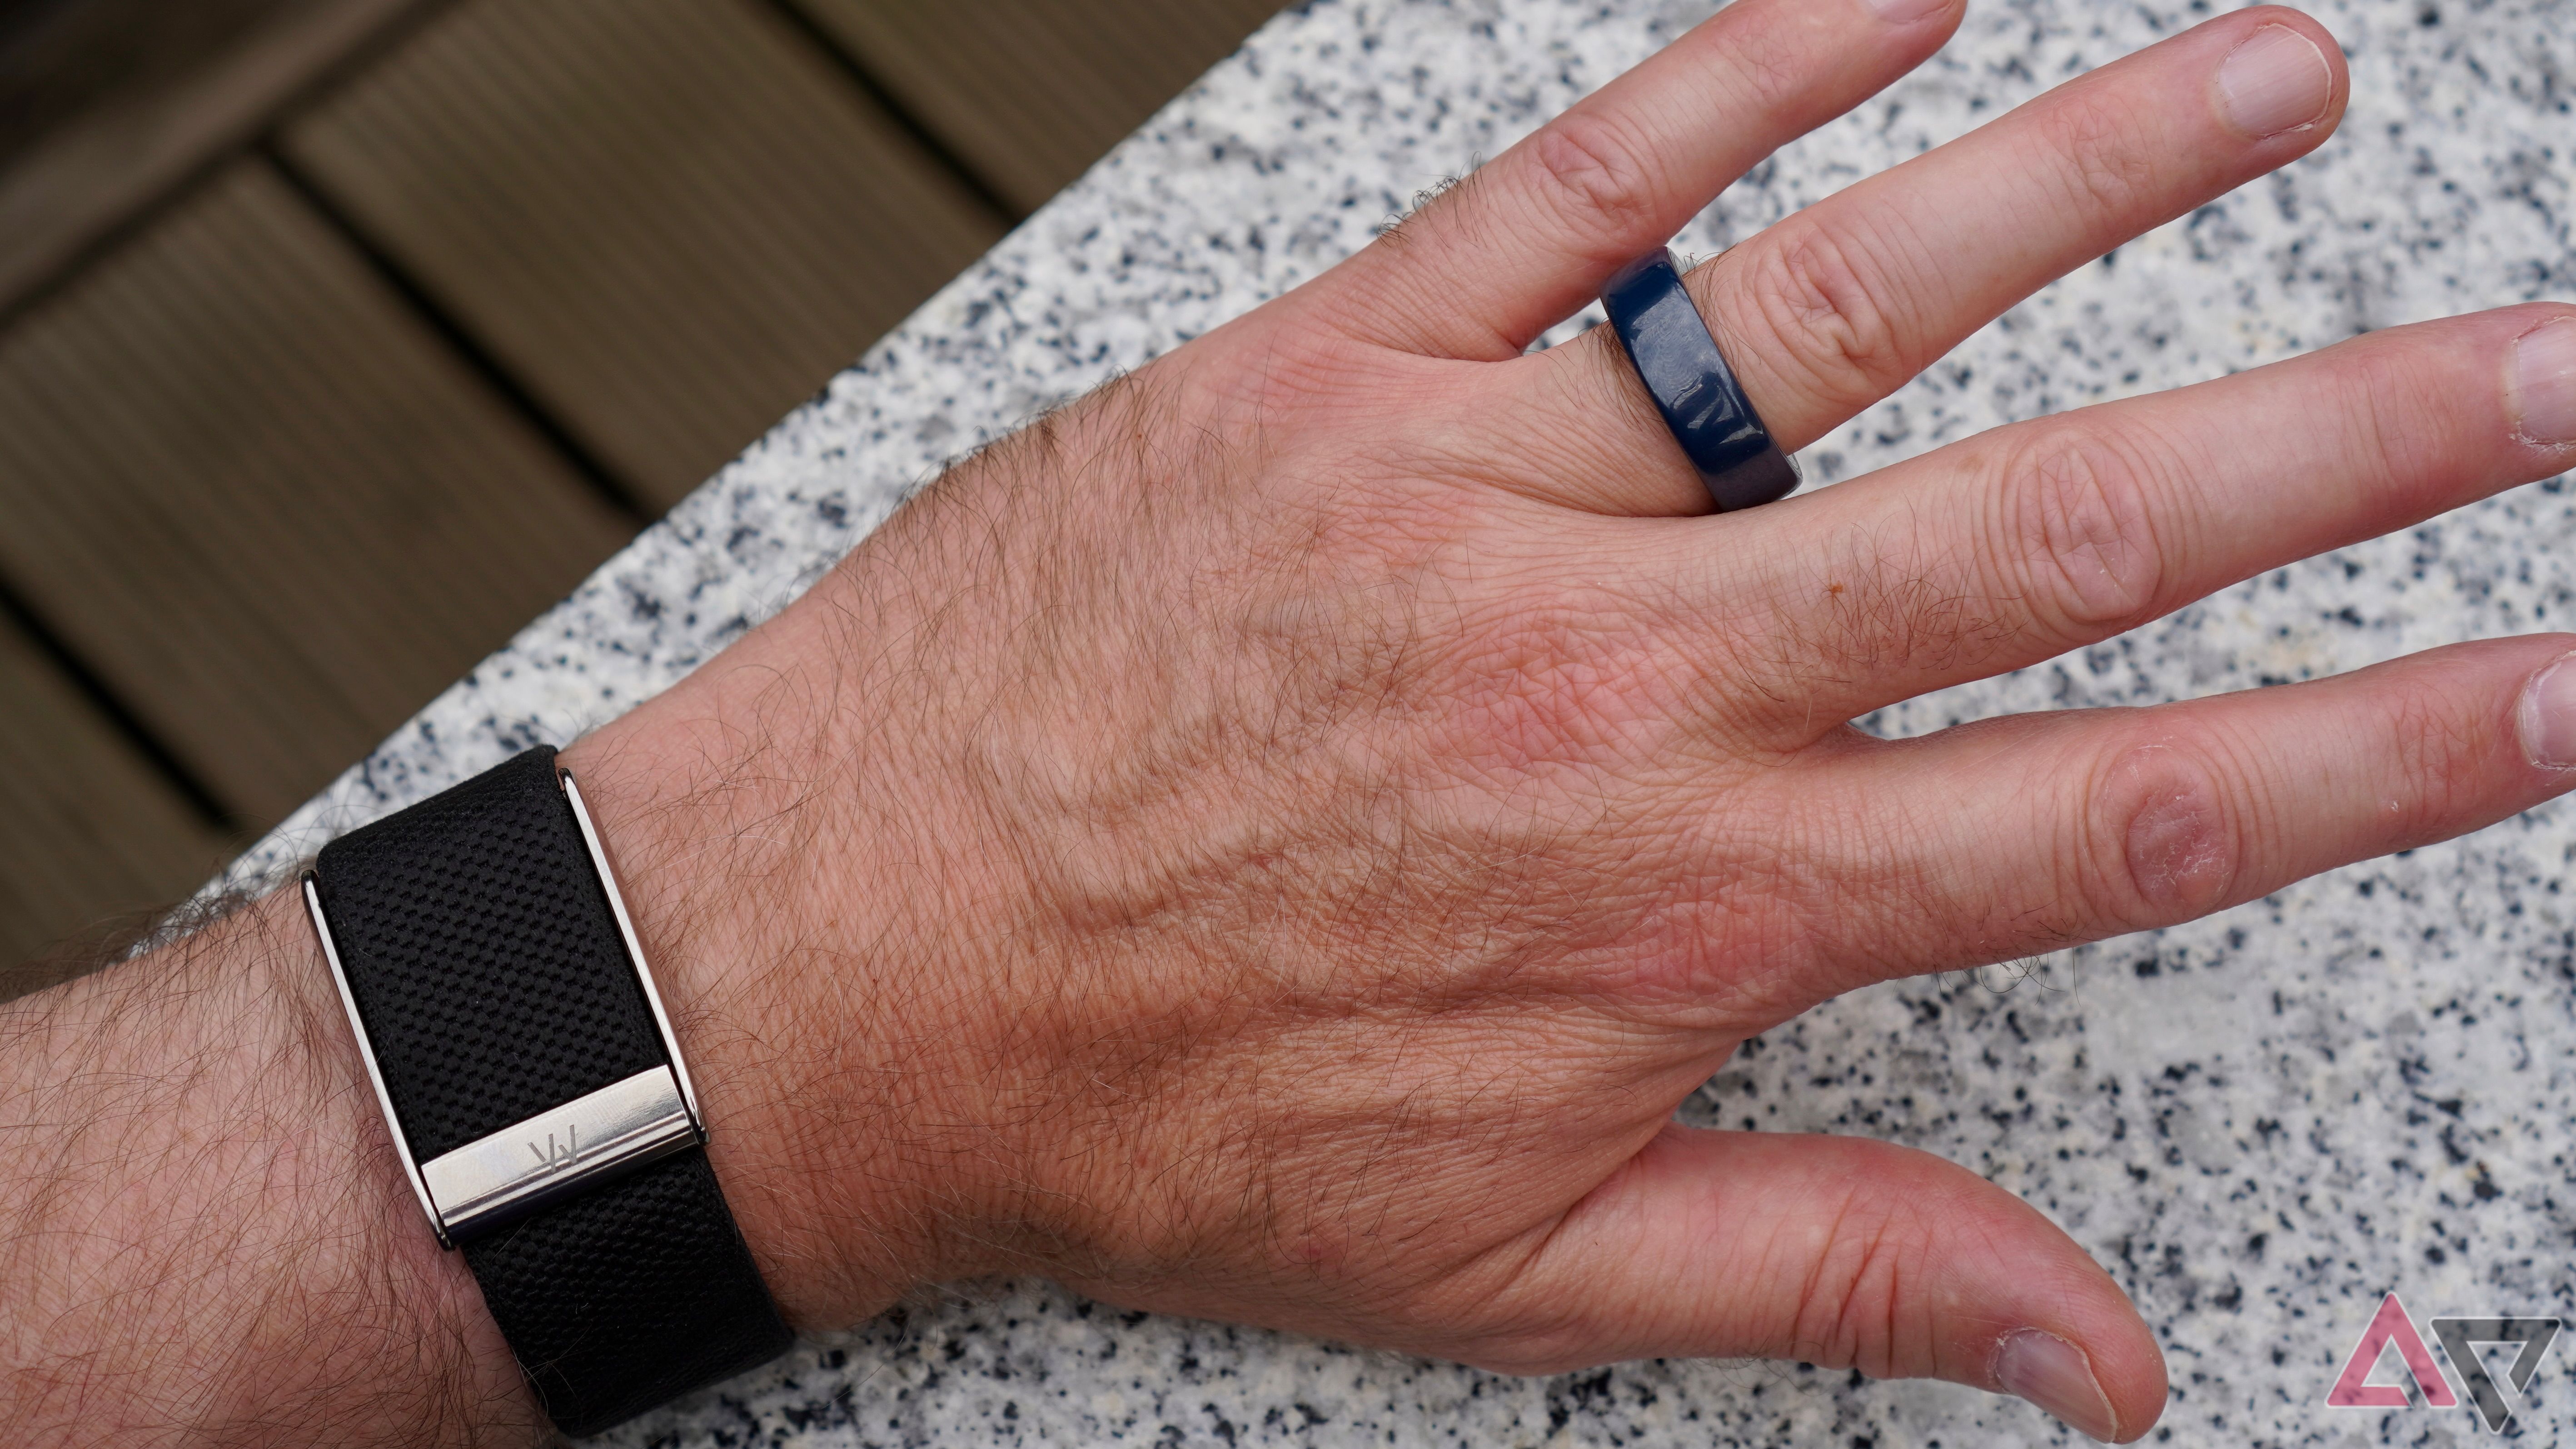
A wearable can be good at measuring nocturnal heart rate variability and still produce a composite recovery score that disagrees with another good wearable. The raw signal and the finished score are not the same thing. The first is a measurement problem. The second is a model-design problem.
The raw HRV data is stronger than the daily score
On nocturnal HRV, both devices deserve more credit than they sometimes get. In a 2025 validation study of consumer wearables, Oura Gen 4 reached a concordance correlation coefficient of 0.99 for nocturnal HRV, while WHOOP 4.0 reached 0.94.[2] That is not a reason to treat either app as a lab instrument in every context, but it does mean the “wearables just guess HRV” dismissal is too blunt.
The same distinction applies to resting heart rate. WHOOP has previously pointed to an AIS/CQUniversity validation study reporting 99.7% heart-rate accuracy versus ECG, although that work used WHOOP 3.0 hardware rather than the current-generation device.[3] The hardware note matters because sensor placement, firmware, and filtering can all change across generations.
So the useful starting point is this: for overnight trend tracking, both Oura and WHOOP can capture the basic physiological signals well enough to be useful for many home-training decisions. If your HRV is running below your own baseline for several nights, your resting heart rate is elevated, and your sleep is short, that pattern is worth noticing. The trouble begins when those inputs get compressed into one polished percentage.
Why the same body becomes two different recovery scores
The Sportsmith analysis that produced the r=0.41 score correlation used WHOOP 3.0 and Oura Gen 2, so it should not be treated as a confirmed 2026 head-to-head result for WHOOP 5.0 and Oura Gen 4.[1] It is still useful because it exposes the central issue: Oura and WHOOP are not simply displaying the same recovery equation in different packaging.
| Layer | What it tells you | What can go wrong |
|---|---|---|
| Raw HRV | How your overnight autonomic signal compares with your own baseline | Can be affected by measurement timing, artifact filtering, illness, alcohol, stress, and normal day-to-day noise |
| Resting heart rate | Whether your overnight cardiovascular load is higher or lower than usual | Can rise for many reasons that are not training readiness |
| Sleep duration and timing | Whether you gave yourself enough recovery opportunity | Does not prove sleep quality or next-day performance |
| Composite score | How the company chooses to combine multiple signals into one recommendation | Depends on proprietary weighting and has not been independently validated as a performance predictor |
WHOOP’s Recovery Score is much more HRV-dominant than Oura’s Readiness model. In the Sportsmith breakdown, about 56% of WHOOP Recovery Score variance was explained by HRV, followed by 27% from resting heart rate, 12% from sleep, and 5% from respiratory rate.[1] That weighting makes WHOOP feel decisive. If HRV drops hard, the score tends to say so.
Oura’s Readiness score is built more like a distributed dashboard. The available breakdown spreads the score across seven contributors: resting heart rate at roughly 29%, HRV at 19%, body temperature at 14%, sleep balance at 14%, previous day activity at 10%, activity balance at 10%, and HRV balance at 5%.[4][5]
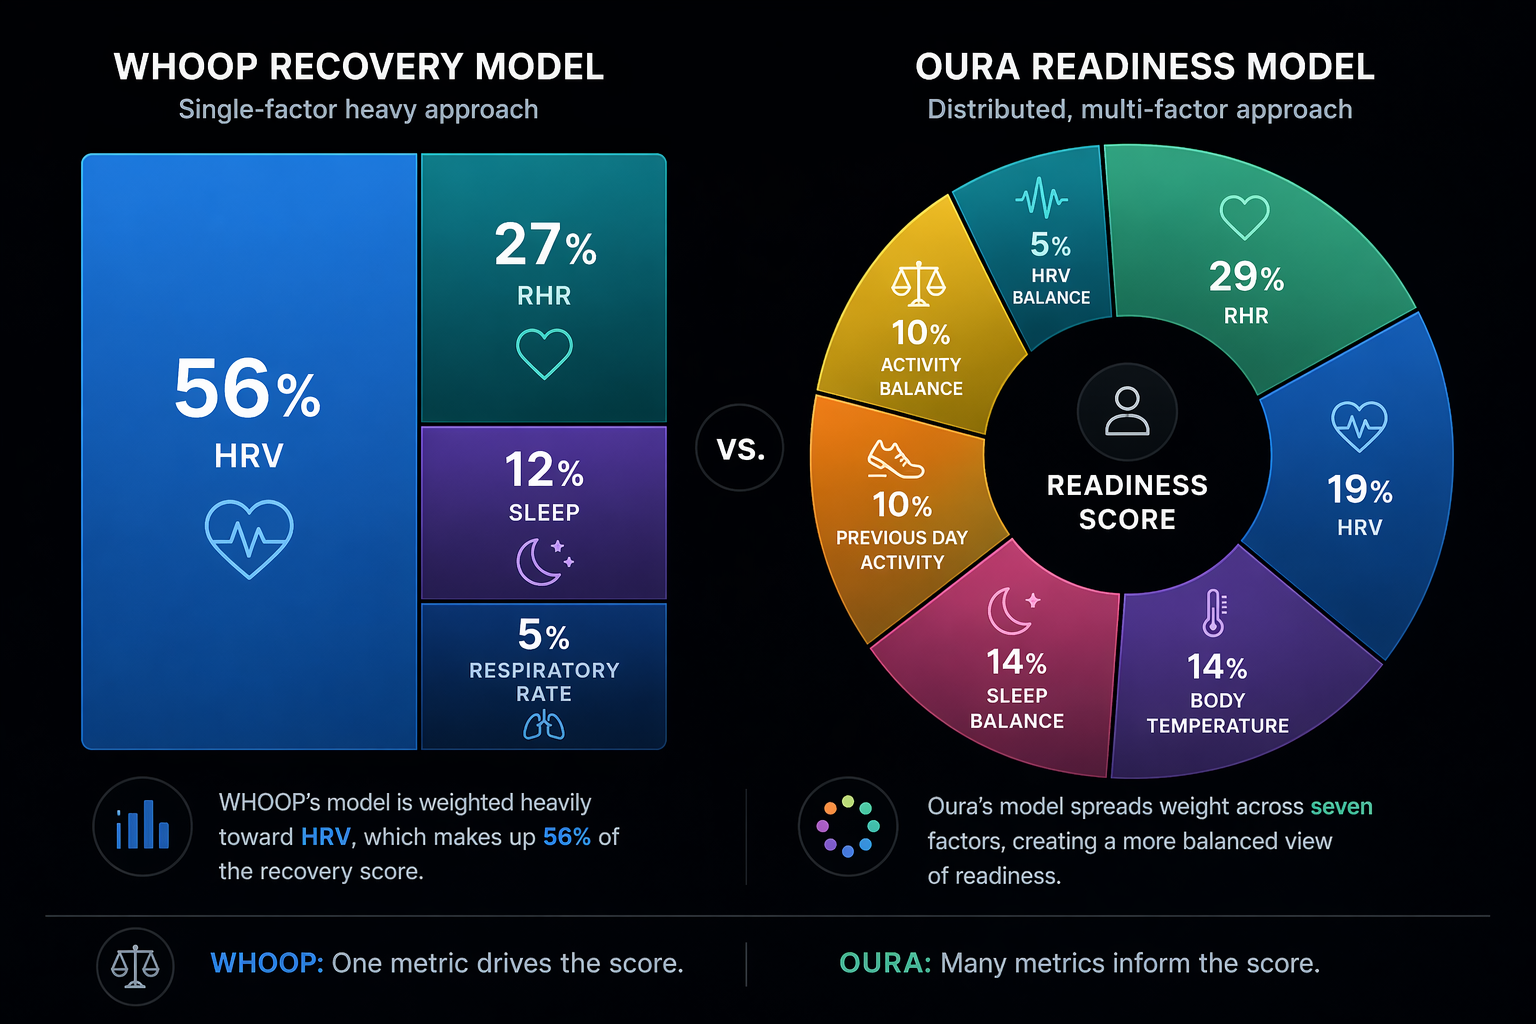
That difference is enough to explain a lot of the same-morning mismatch. Imagine a hypothetical night where HRV is unusually low, but resting heart rate is normal, sleep duration is solid, and body temperature is unremarkable. A model that gives HRV most of the vote can flash yellow or red. A model that spreads the vote across several contributors can still land in a high-readiness zone.
Reverse the inputs and the disagreement can flip. If HRV looks fine but resting heart rate is elevated and sleep balance has been poor for several nights, Oura may have more reasons to mark readiness down while WHOOP may not react as strongly. Neither response is automatically irrational. Each is the consequence of a design choice.
This is where “which is more accurate?” becomes too vague to be useful. Oura Gen 4 may have the stronger published nocturnal HRV agreement in the 2025 validation study.[2] WHOOP may give a cleaner training nudge for users who want HRV to dominate the decision. But a recovery percentage is not just measured; it is authored. The app decides which signals count, how much they count, and how much smoothing or baseline comparison happens before the number reaches you.
A high HRV score is not the same as a proven performance prediction
The biggest evidence gap is not whether the devices can measure heart rate or HRV. It is whether their composite recovery scores have been independently validated to predict what users often assume they predict: today’s training performance, injury risk, or illness. Published independent outcome validation for either Oura Readiness or WHOOP Recovery in home fitness populations is still missing from the cited evidence.
That does not make the scores useless. A single number can be a helpful friction point. It can make a person notice that three short nights, an elevated resting heart rate, and a depressed HRV trend are stacking up. But it should not carry the authority of a test result. If a heavy lower-body session is planned and the device says 42%, the useful next step is not blind obedience; it is to inspect the inputs and compare them with how you actually feel and perform during warmups.
This is also why two users can prefer different systems for good reasons. WHOOP’s HRV-heavy score can suit someone who wants a clear coaching-style signal and is comfortable letting autonomic data drive the day’s training intensity. Oura’s multi-factor readiness model can suit someone who wants recovery framed as a broader state: sleep debt, body temperature, activity strain, resting heart rate, and HRV together.
The purchase decision is partly a methodological preference. Do you want the device to be opinionated, especially when HRV moves? Or do you want it to hedge across several recovery signals before nudging you? Neither preference is inherently more scientific unless the score has been tested against the outcome you care about.
Sleep staging should lower your confidence in the composite score
Sleep is one of the places where the gap between a clean app interface and messy validation evidence becomes obvious. Oura’s Gen 3 sleep-staging algorithm reported κ=0.65 in an Oura-funded validation study.[6] But independent Korean multicenter findings placed Oura sleep-stage agreement much lower, in the κ=0.2–0.4 range.[6]
That does not mean sleep information is worthless. Sleep duration, sleep timing, and repeated disruptions can still be useful context. The caution is narrower: fine-grained sleep stages should not be treated as equally reliable as overnight heart rate or HRV trends. If a recovery score leans partly on sleep-stage interpretation, that part of the score carries more uncertainty than the app may visually imply.
For training decisions, this usually means sleep duration and consistency deserve more attention than whether the app says a specific block was light, deep, or REM sleep. The body knows it had five hours. The ring or band is making a harder inference when it divides that night into stages.
Hardware generations complicate simple rankings
Any current Oura-versus-WHOOP comparison has to be careful about time. The striking r=0.41 score correlation came from WHOOP 3.0 and Oura Gen 2, not the newest hardware available in 2026.[1] The 2025 nocturnal HRV validation used Oura Gen 4 and WHOOP 4.0.[2] WHOOP has released newer hardware since then, but no published WHOOP 5.0-specific independent validation study is identified in the public sources cited here.
That leaves shoppers with an unsatisfying but honest answer. The newer devices may have better sensors and updated algorithms. They may also still disagree because the disagreement is not only a sensor problem. If Oura and WHOOP continue to weight recovery inputs differently, improved HRV accuracy alone will not make their final scores converge.
How to read the scores without letting them run your training
The most useful way to use either device is to separate the number from the evidence underneath it. Start with the composite score if it helps you notice the morning. Then open the underlying trends before changing the plan.
- Check HRV against your own baseline, not another person’s number.
- Check resting heart rate for unusual elevation, especially across multiple nights.
- Check sleep duration and timing before overreacting to sleep-stage labels.
- Check whether recent training load, alcohol, travel, stress, or heat plausibly explains the signal.
- Use the first work sets or warmup as a reality check before committing to a hard session or abandoning one.
That approach lines up with recovery researcher Shona Halson’s practical caution against obsessing over the composite numbers and her recommendation to focus more on raw signals such as HRV, resting heart rate, and sleep duration.[7] It is not as tidy as a green, yellow, or red screen. It is also less likely to turn one noisy morning into a needless rest day or a needless max-effort session.
So which is more accurate for recovery tracking?
For nocturnal HRV accuracy, the best cited head-to-head evidence in this brief favors Oura Gen 4 over WHOOP 4.0, with CCC 0.99 versus 0.94.[2] For the finished recovery score, the evidence does not support a clean winner. WHOOP and Oura are answering slightly different questions with overlapping inputs.
Choose WHOOP if you want a recovery system that gives HRV a large vote and turns that into a more directive training signal. Choose Oura if you want a readiness system that spreads attention across resting heart rate, HRV, temperature, sleep balance, and activity context. Then judge the device by whether its trends help you make better decisions over several weeks, not by whether today’s percentage feels authoritative.
Both devices can be credible trend tools. Neither composite score has been independently validated to predict performance, injury, or illness in the way many users casually interpret it. The most actionable recovery signal is the pattern: HRV, resting heart rate, sleep duration, and your actual response to training over time.
References
- Whoop vs Oura Ring: Real-life data, analysis and comparisons, Sportsmith
- Validation of Nocturnal Resting Heart Rate and Heart Rate Variability in Consumer Wearables, Physiological Reports, 2025
- WHOOP Proven Most Accurate Wearable in Heart Rate & Heart Rate Variability Measurements, WHOOP
- Readiness Score, Oura Support
- Readiness Score, Oura
- Accuracy Assessment of Oura Ring Nocturnal Heart Rate and Heart Rate Variability in Comparison With Electrocardiography in Time and Frequency Domains: Comprehensive Analysis, JMIR, 2022
- Dietitian Approved podcast with Shona Halson, Dietitian Approved
Comments
Join the discussion with an anonymous comment.