The Data Gap: Why Most Users Don't Get Full Value From Their Smart Watch
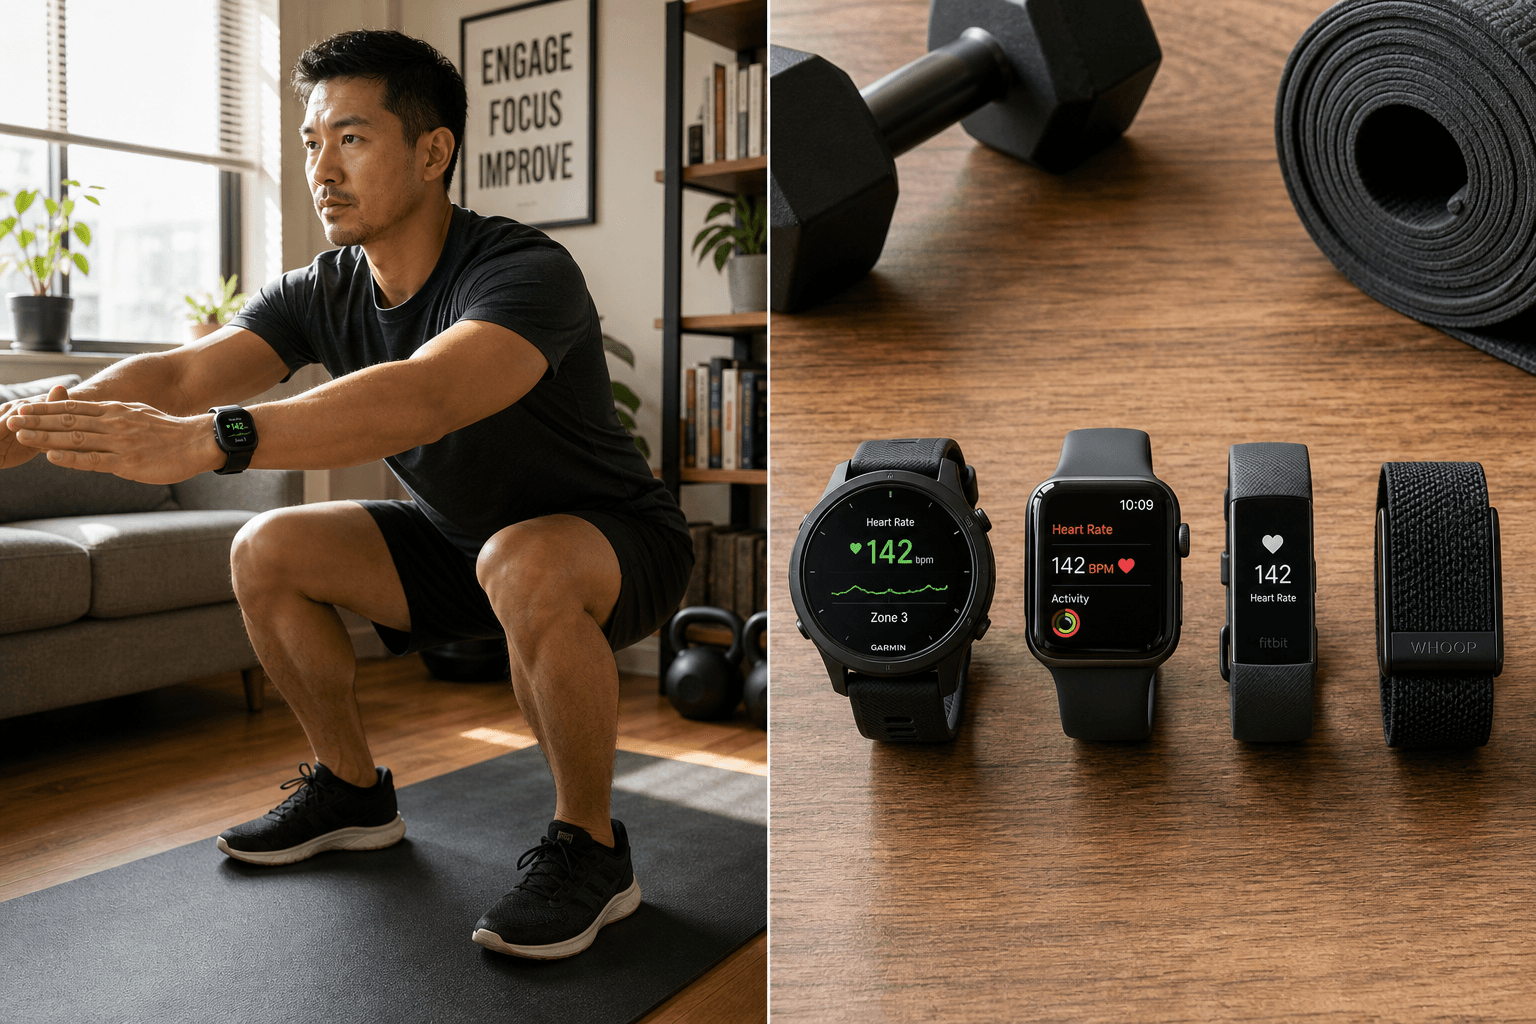
Walk into any home gym and you'll see wrists wrapped in Garmins, Whoops, Fitbits, and Apple Watches. Most of those devices are collecting data around the clock — heart rate, sleep stages, stress levels, movement patterns — yet the vast majority of owners use only a fraction of what their watch can actually do. Step counts, maybe a few workout recordings, and a glance at the time. The advanced metrics that could meaningfully shape how you train sit untouched in menus most users never open.
This isn't a hardware problem. The sensors in modern wearables are genuinely capable. The gap is in interpretation. Knowing your heart rate during a set of dumbbell presses is useless unless you understand what zone you should be targeting. Seeing a Recovery score of 40% means nothing if you don't know whether that signals a rest day or just a lighter session. The data is there; the context is what's missing.
This guide is for the intermediate home exerciser who already owns a smart watch or is about to buy one. We're not comparing devices or telling you which model to choose. We're covering the specific features — heart rate zones, recovery readiness, HRV trends, strength tracking, and sleep data — that can produce measurable improvements in your home workouts, and explaining exactly how to interpret and act on each one.
Heart Rate Zone Training for Home Workouts
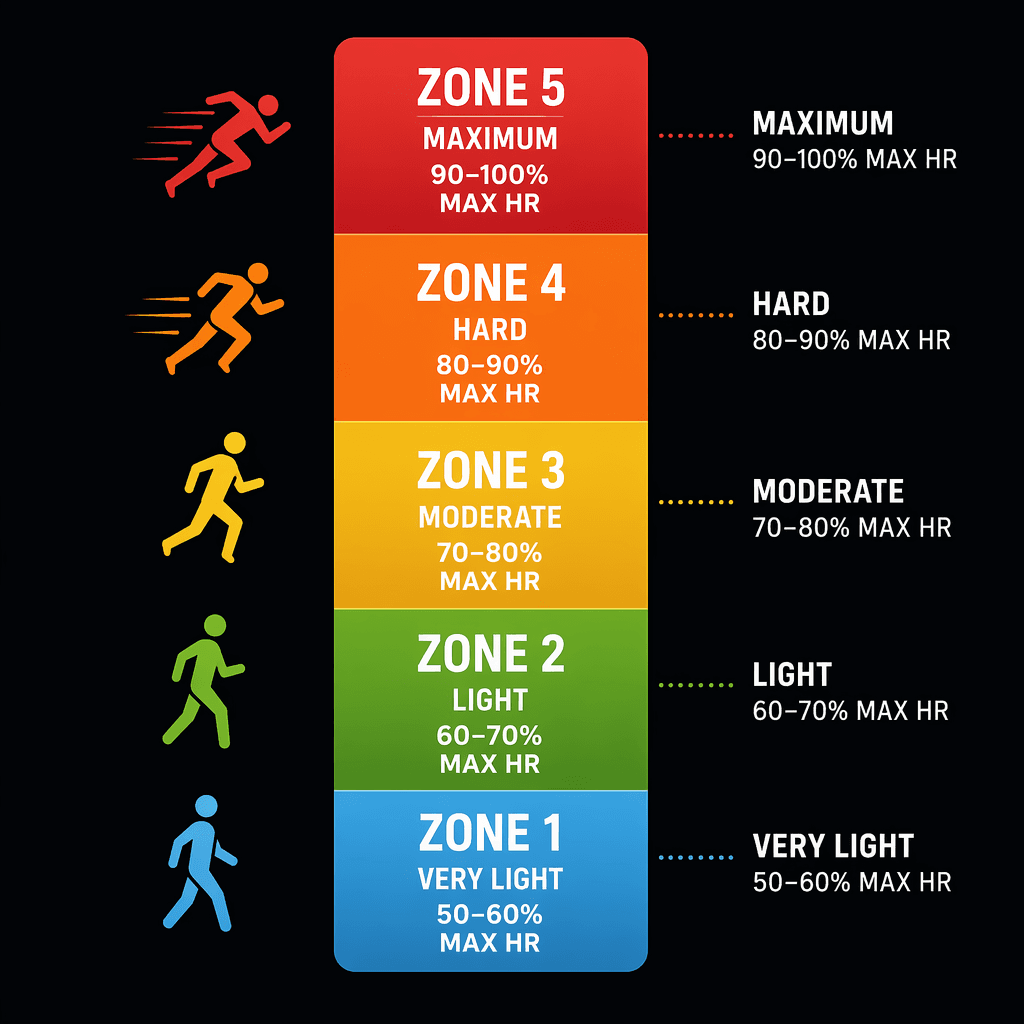
Heart rate zone training is the single most impactful feature most smart watch owners never configure. The concept is straightforward: your maximum heart rate is divided into five zones, each corresponding to a different physiological demand and training outcome. Zone 2 (60–70% of max) builds aerobic endurance and is ideal for steady-state cardio on a treadmill or exercise bike. Zone 4 (80–90%) pushes you into the threshold zone where HIIT and high-intensity intervals live. Zone 5 (90–100%) is for all-out efforts lasting no more than a few minutes.
The problem is that most people train in a gray middle zone — hard enough to feel tired, but not structured enough to produce a specific adaptation. A smart watch with zone alerts can fix this. Set your zones once (most devices auto-calculate based on your profile, or you can enter a known max HR from a field test), then use the watch's real-time display to stay in the intended zone throughout your session.
Accuracy Expectations: Wrist-Based vs. Chest Strap
Wrist-based optical heart rate sensors have improved dramatically, but they are not chest straps. In CNET's lab testing across over 30 miles of runs, the Apple Watch Series 11 recorded an average heart rate error of just 0.98% — roughly 1.40 beats per minute — when compared against the Polar H10 chest strap, making it the most accurate wrist-based monitor in that test. The Garmin Venu 4, which samples heart rate every second (versus every five seconds on the Apple Watch), posted a 3.89% error rate.
| Device | Avg. HR Error vs. Polar H10 | Sampling Rate |
|---|---|---|
| Apple Watch Series 11 | 0.98% (~1.40 BPM) | Every 5 seconds |
| Garmin Venu 4 | 3.89% | Every 1 second |
| Google Pixel Watch 4 | Not specified in test | Not specified |
| Samsung Galaxy Watch 8 | Not specified in test | Not specified |
| Amazfit Bip 6 | Not specified in test | Not specified |
For home workouts, the practical takeaway is this: wrist-based HR is accurate enough for steady-state Zone 2 work and most HIIT sessions. If you're doing structured threshold intervals or lactate work, consider pairing your watch with a Bluetooth chest strap for the duration of that session. Most modern watches (Garmin, Apple Watch, Polar, Wahoo) support external HR sensors seamlessly.
Recovery Readiness Scores: Body Battery, Daily Readiness, and Recovery
One of the most useful advances in consumer wearables is the shift from passive tracking to active readiness guidance. Garmin's Body Battery, Fitbit's Daily Readiness Score, and Whoop's Recovery score all attempt to answer the same question: "How ready is my body to perform today?" Each platform uses a different formula, but the underlying logic is similar — combining overnight heart rate, HRV, sleep quality, and recent training load into a single actionable number.
| Platform | Metric Name | Scale | Key Inputs |
|---|---|---|---|
| Garmin | Body Battery | 1–100 | Sleep, stress, rest, physical activity (updates dynamically) |
| Fitbit | Daily Readiness Score | 1–100 | Sleep, HRV, recent activity, resting heart rate |
| Whoop | Recovery | 0–100% | HRV, resting heart rate, sleep performance, respiratory rate |
Garmin's Body Battery is unique in that it updates throughout the day, not just upon waking. It combines sleep, stress, and activity data into a dynamic 1–100 energy score that rises during rest and falls during exertion. If you wake up at 85 and drop to 40 by mid-afternoon after a stressful work call, that's useful context for whether your evening HIIT session is a good idea.
Whoop's Recovery score is the most training-focused of the three. It's expressed as a percentage and directly feeds into the platform's Strain recommendations — a green recovery (above 67%) suggests you can handle a high-strain day, while a red recovery (below 33%) is a clear signal to take it easy or do active recovery. The score is heavily weighted toward HRV and resting heart rate measured during your last sleep period.
Fitbit's Daily Readiness Score works similarly but is presented as a simple 1–100 number with a brief explanation of contributing factors. It also suggests whether you're ready for a high, moderate, or low activity day.
HRV Trends: What They Measure and How to Act on Them
Heart Rate Variability (HRV) measures the variation in time between consecutive heartbeats. Contrary to what the name might suggest, higher HRV is generally a sign of a well-recovered, adaptable nervous system, while lower HRV can indicate accumulated stress, poor sleep, or impending illness. It's one of the most physiologically informative metrics a wearable can track — and one of the easiest to misinterpret.
The critical rule for HRV is that it is a trend metric, not a single-day number. Your HRV on any given morning is influenced by dozens of variables: what you ate the night before, alcohol consumption, sleep quality, stress from work, even the time you woke up. Looking at a single reading and drawing a conclusion is meaningless. What matters is the seven-day rolling average and whether that average is trending up, down, or holding steady.
Most platforms handle this automatically. Whoop displays your HRV as a baseline with a colored indicator showing where today's reading falls relative to your personal range. Garmin surfaces HRV status in the training readiness widget. Apple Watch users can access HRV data through the Health app, though the interpretation layer is thinner.
For home exercisers, HRV is especially useful because it captures the cumulative effect of all stressors — not just your workouts. A tough week at work, poor sleep, and three hard training sessions in a row will show up in your HRV trend before you feel it subjectively. That early warning gives you the chance to back off before overtraining sets in.
Strength Training Features: Rep Counting, Rest Timers, and Muscle Load
For years, wearables were biased toward cardio. Running, cycling, and swimming got detailed metrics while weightlifting was reduced to a generic "strength training" activity type that recorded little more than duration and average heart rate. That has changed. Several platforms now offer dedicated strength-tracking features that bring the same data-driven approach to dumbbell presses and squats that runners have enjoyed for a decade.
| Feature | Whoop 5.0 | Garmin (Venu, Forerunner) | Apple Watch |
|---|---|---|---|
| Rep counting | Via Strength Trainer (accelerometer/gyroscope) | Auto-rep counting for select exercises | Manual via third-party apps |
| Rest timer | Built into Strength Trainer | Built into strength activity profile | Not native |
| Muscular load tracking | Yes — assigns Strain based on load | Not native | Not native |
| Custom workout builder | Yes — sets, supersets, intervals | Via Garmin Connect | Via third-party apps |
| Post-workout breakdown | Cardiovascular vs. muscular load, total tonnage | Sets, reps, rest times | Basic summary |
Whoop's Strength Trainer is the most advanced implementation currently available. It uses the inbuilt accelerometer and gyroscope to detect each rep and assign muscular load, factoring that load into the daily Strain score (0–21). This is a meaningful improvement over heart-rate-only tracking because weightlifting produces a cardiovascular response that is disproportionate to the actual muscular demand — your heart rate might spike during a heavy set of squats, but it doesn't capture the mechanical tension on your muscles. Whoop's approach closes that gap.
Garmin's strength tracking is more basic but still useful. The watch auto-detects reps for common exercises (bench press, bicep curls, shoulder press) and logs rest times. You can review your sets and reps post-workout in Garmin Connect. It lacks the muscular load dimension that Whoop offers, but for home exercisers who want to track volume and rest intervals, it's a solid tool.
Apple Watch users have access to strength tracking primarily through third-party apps like Strong, Hevy, or Fitbod, which sync workout data to Apple Health. The watch itself does not natively count reps or track muscular load for strength training.
Using Sleep Data to Adjust Workout Timing and Intensity
Sleep is the foundation of recovery, and modern wearables track it in enough detail to inform training decisions. Most devices record sleep stages (light, deep, REM), overnight heart rate, respiratory rate, and a composite sleep score. Garmin goes a step further with nap detection and a Sleep Score that factors in duration, consistency, and restoration quality.
The practical application for home exercisers is timing and intensity calibration. If your sleep score is low — say, below 70 on Garmin's scale — your nervous system is not fully recovered. That is not the day to attempt a PR on your deadlift or push through a grueling HIIT session. It is, however, a perfectly good day for a 30-minute Zone 2 walk on a treadmill or a mobility session.
- High sleep score (80+): Full training intensity. Your body is ready to handle high strain.
- Moderate sleep score (60–79): Proceed with planned workout but monitor how you feel during the warm-up. Be ready to dial back intensity if your body isn't responding.
- Low sleep score (below 60): Switch to active recovery. A 20-minute walk, light stretching, or foam rolling session will serve you better than forcing a hard workout.
Garmin's nap detection adds another layer. A well-timed 20–30 minute nap can meaningfully improve afternoon readiness, and the watch will log it as recovery time. For home exercisers with flexible schedules, this is a practical tool — if your morning workout was cut short or you slept poorly, a nap before an afternoon session can change the quality of that training.
Common Pitfalls: Data Obsession, Optical HR Limitations, and Tattoo Interference
More data is not always better. The most common mistake among smart watch users is treating every metric as an absolute truth and making training decisions based on single data points rather than trends. This leads to unnecessary rest days, anxiety about normal physiological fluctuations, and a loss of trust in the device when the numbers don't match how you actually feel.
The data from your watch is a guide, not a command. If your Recovery score is low but you feel great and your warm-up goes smoothly, train. If your HRV is elevated but you feel fatigued and sluggish, rest. The metrics are most useful when they confirm or challenge what your body is already telling you — not when they override it.
Optical heart rate sensors have well-documented limitations. They can struggle with darker skin tones and tattoos, particularly dark or dense ink on the wrist where the sensor sits. Users with these characteristics may find that their watch consistently under- or over-reports heart rate during exercise. The solution is not to abandon the device but to calibrate expectations: use a chest strap for sessions where HR accuracy matters most, and treat the wrist-based readings as directional rather than precise.
- Don't make training decisions based on a single metric. Always look at the combination of readiness score, HRV trend, sleep quality, and subjective feel.
- If you have tattoos on your wrist, test your watch's HR accuracy against a chest strap during a few workouts. If the readings diverge significantly, plan to use the chest strap for high-intensity sessions.
- Ignore calorie burn data for nutrition purposes. It is not reliable enough to inform eating decisions.
- Remember that all wearables are consumer devices, not medical instruments. If you have health concerns, consult a healthcare provider.
Your 3-Step Action Plan: Start Using Metrics to Improve Results This Week
You don't need to overhaul your entire training approach overnight. The following three steps are designed to be implemented this week, using the device you already own, without buying any additional equipment.
- Set up your heart rate zones. Open your watch's settings or companion app and confirm that your zones are configured correctly. If your device auto-calculates zones based on your profile, verify that your age and resting heart rate are accurate. Then, during your next cardio session, keep your watch display on the heart rate screen and consciously stay in Zone 2 for the first 20 minutes. You'll likely find you need to slow down — that's the point.
- Check your recovery score before every workout for one week. Before you start your warm-up, look at your readiness or recovery metric. If it's in the green, proceed with your planned session. If it's yellow, start your warm-up and decide after five minutes whether to proceed or dial back. If it's red, swap your planned workout for active recovery — a walk, mobility work, or light stretching. Do this for seven days and note how it affects your energy and performance.
- Log one strength session with rep tracking. If you have a Whoop, use the Strength Trainer to build a simple workout (three exercises, three sets each). If you have a Garmin, start a strength activity and let the watch count reps. If you have an Apple Watch, use a third-party app like Strong or Hevy. The goal is not to obsess over the numbers — it's to see what your device captures and start building the habit of structured strength logging.
After one week, you'll have a clearer picture of which metrics are useful for your specific training style and which ones you can safely ignore. The goal is not to become a data scientist — it's to make your smart watch work for you, rather than the other way around.
Comments
Join the discussion with an anonymous comment.