Oura Ring Accuracy: What 8 Peer-Reviewed Studies Actually Say About Sleep, HRV, Heart Rate, and Recovery Tracking
This article provides a transparent, evidence-based breakdown of Oura Ring accuracy across sleep staging, HRV, resting heart rate, temperature, step count, and active heart rate. It compares company-funded and independent study results, discloses funding sources, and helps data-driven home fitness enthusiasts decide which metrics to trust and which to treat as directional.
Why Oura Ring Accuracy Matters for Home Fitness Recovery
If you train at home without a coach watching your form or a gym partner pushing you through a plateau, your wearable becomes your primary feedback loop. It tells you whether you recovered from yesterday's session, whether your nervous system is ready for another hard effort, and whether you should take a rest day instead. For that feedback loop to be useful, the data feeding it has to be trustworthy.
The Oura Ring has carved out a distinct position in the wearable market by focusing almost entirely on recovery and sleep rather than real-time workout tracking. Its Readiness Score, which synthesizes seven contributors including HRV balance, resting heart rate, body temperature, and sleep quality, is the centerpiece of that value proposition. But the question any data-driven home fitness enthusiast should ask before relying on that score is straightforward: how accurate are the underlying measurements, and which ones can you actually trust?
This article aggregates findings from eight peer-reviewed studies published between 2023 and 2025, covering Oura Ring generations 2 through 4 across sleep staging, heart rate variability (HRV), resting heart rate (RHR), skin temperature, step count, active heart rate, and calorie estimation. Every study is cited with its funding source disclosed, and the significant gap between company-funded and independent results is addressed directly. The goal is not to declare Oura "accurate" or "inaccurate" as a blanket statement, but to give you a metric-by-metric breakdown so you know which numbers to act on and which to treat as directional.
The Evidence Base: 8+ Peer-Reviewed Studies (2023–2025)
Before diving into individual metrics, it helps to see the full landscape of studies that inform this analysis. The table below summarizes the key studies cited in this article, including sample sizes, device generations tested, and funding sources. This context matters because study design and funding have a measurable impact on reported accuracy figures.
| Study | Year | Sample Size | Device Tested | Metrics Covered | Funding Source |
|---|---|---|---|---|---|
| Dial et al. (Ohio State / Air Force Research Lab) | 2025 | 13 participants, 536 nights | Oura Gen 4 | HRV, RHR | Independent (no industry funding) |
| Brigham and Women's Hospital | 2024 | Not specified in source | Oura Ring Gen 3 | Sleep staging | Oura-funded |
| Park et al. (Korean multicenter) | 2023 | 75 participants, 349,114 epochs | Oura Ring 3 | Sleep staging | Independent |
| University of Tokyo | 2024 | 96 participants, 421,045 epochs | Oura Ring Gen 2 & Gen 3 | Sleep staging | Partly Oura-funded (Oura did not participate in data analysis or writing) |
| Oura internal validation | Not specified | 16 participants, 93,571 data points | Oura Ring | Skin temperature | Oura internal |
| Meta-analysis (aggregated by Kygo) | 2026 | Multiple studies aggregated | Oura Ring (generations not specified per metric) | Step count, active HR, calorie estimation | Independent aggregation |
Sleep Staging Accuracy: Company-Funded vs. Independent Results
Sleep staging — the ability to distinguish between light sleep, deep sleep, REM sleep, and wake — is one of the most technically challenging tasks for any wearable. Polysomnography (PSG), the clinical gold standard, uses electroencephalography (EEG), electrooculography (EOG), and electromyography (EMG) to classify sleep stages. A ring-based PPG sensor attempts to infer the same stages from heart rate, heart rate variability, and movement patterns. The gap between these two approaches is where the accuracy debate lives.
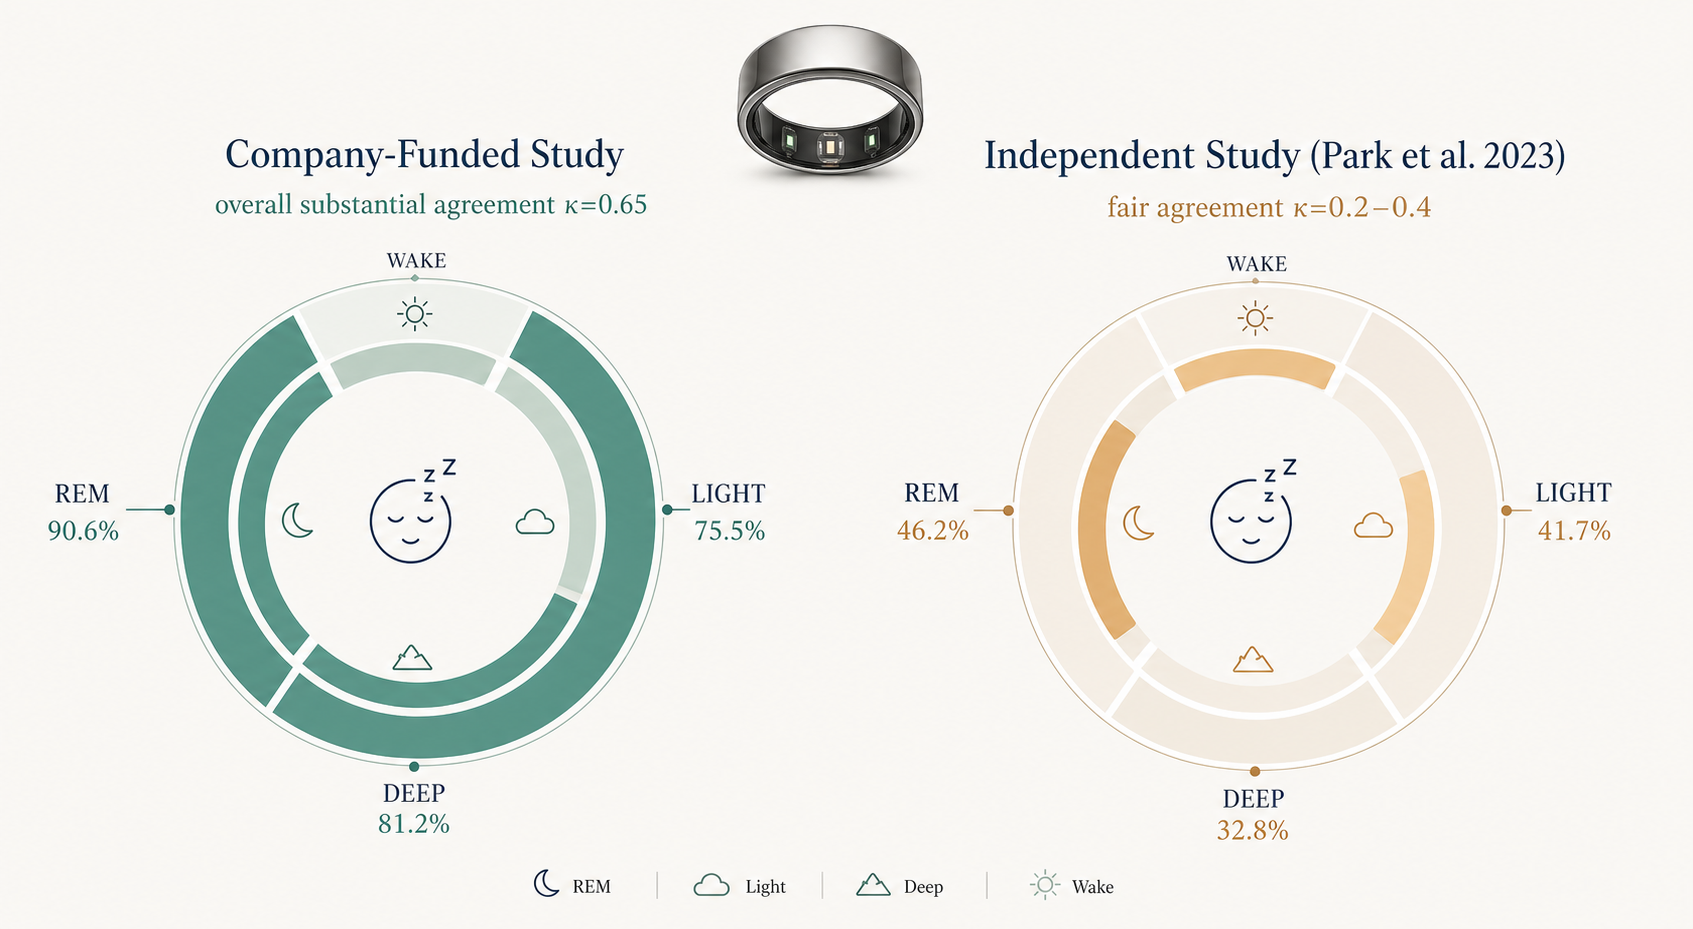
The most commonly cited statistic in Oura's marketing materials comes from the Brigham and Women's Hospital study (2024), which reported a Cohen's kappa (κ) value of 0.65 for Oura Ring Gen 3 against PSG. In the context of sleep staging, a κ of 0.65 is classified as "substantial agreement." For comparison, the same study rated the Apple Watch Series 8 at κ = 0.60 and the Fitbit Sense 2 at κ = 0.55. This is a respectable result, and it is the basis for Oura's claim that its sleep staging leads the consumer wearable category.
However, the Brigham study was funded by Oura. When an independent group — the Korean multicenter study led by Park et al. (2023) — tested the same Oura Ring 3 against PSG in 75 participants across 349,114 epochs, the results were markedly different. Park et al. reported a κ range of 0.2 to 0.4, which falls into the "fair agreement" category. That is a wide gap: from substantial to fair, depending on who is running the study.
| Study | Funding | Kappa (κ) Value | Agreement Classification |
|---|---|---|---|
| Brigham and Women's Hospital (2024) | Oura-funded | 0.65 | Substantial |
| Park et al. Korean multicenter (2023) | Independent | 0.2 – 0.4 | Fair |
| University of Tokyo (2024) | Partly Oura-funded | 75.5% – 90.6% accuracy by stage | Not reported as kappa |
The University of Tokyo study (2024), which was partly Oura-funded but with the explicit caveat that Oura did not participate in data analysis or writing, reported sleep staging accuracy ranging from 75.5% for light sleep to 90.6% for REM sleep, with overall sensitivity of 94.4% to 94.5%. These figures fall between the Brigham and Park results. The study also found that Oura Ring "did not significantly differ" from PSG for time in bed, total sleep time, sleep onset latency, and time in light and deep sleep. Inter-device reliability was 94.8%.
What does this mean for you? If you are using Oura to track general sleep trends — whether your deep sleep duration is increasing or decreasing week over week — the ring is likely reliable enough for that purpose. The inter-device reliability of 94.8% from the University of Tokyo study suggests that the ring is consistent with itself night after night. But if you are relying on the absolute values ("I got exactly 1 hour and 47 minutes of deep sleep last night") for clinical or training decisions, the margin of error is wider than the marketing suggests.
HRV and Resting Heart Rate: Oura's Strongest Category
If there is one category where Oura genuinely excels, it is nocturnal heart rate variability and resting heart rate. The Dial et al. (2025) study conducted at Ohio State University in collaboration with the Air Force Research Lab is the strongest evidence for this claim. The study was independent — no industry funding — and involved 13 participants across 536 nights of data collection. Participants wore an Oura Gen 4 ring alongside a Polar H10 chest strap, which is widely considered a research-grade ECG reference for HRV measurement.
The results were striking. Oura Gen 4 achieved a concordance correlation coefficient (CCC) of 0.99 for nocturnal HRV against the Polar H10. A CCC of 0.99 is classified as "nearly perfect" agreement. For resting heart rate, the CCC was 0.98 with a mean absolute percentage error (MAPE) of just 1.94%. These are not directional numbers — they are laboratory-grade measurements.
| Metric | CCC vs. Polar H10 ECG | Error Rate | Classification |
|---|---|---|---|
| Nocturnal HRV | 0.99 | Not specified | Nearly perfect agreement |
| Resting Heart Rate | 0.98 | MAPE 1.94% | Nearly perfect agreement |
There is an important nuance here: these results apply specifically to nocturnal measurements taken during sleep. Oura's PPG sensor benefits from the stable conditions of sleep — minimal movement, consistent skin contact, and a predictable physiological state. Daytime HRV measurements, taken during periods of activity, stress, or post-meal digestion, are far more variable and have not been validated to the same standard. For recovery tracking, this distinction matters because nocturnal HRV is precisely the metric that feeds into Oura's Readiness Score and HRV balance contributor.
For the home fitness enthusiast, this means Oura's nocturnal HRV and RHR data are trustworthy inputs for recovery decisions. If your Readiness Score is low because your HRV balance is negative, you can have reasonable confidence that the underlying HRV measurement is accurate. This is the metric to lean on when deciding between a hard training day and an active recovery session.
Skin Temperature: Best-in-Class Precision
Skin temperature tracking is one of Oura's most distinctive features, and the internal validation data suggests it is genuinely best-in-class. Oura's internal testing, conducted with 16 participants and 93,571 data points, reported an r² value greater than 0.99 in laboratory conditions with a precision of ±0.13°C per minute. In real-world conditions, the r² remained above 0.92.
An r² of 0.99 means that 99% of the variance in the reference thermometer's readings can be explained by the Oura Ring's readings. This is an exceptionally high correlation. The ±0.13°C precision means the ring can detect temperature changes smaller than most people's normal circadian variation, which typically ranges from 0.5°C to 1.0°C over a 24-hour period.
This level of precision is what enables Oura's Rest Mode auto-detection feature. When the ring detects an elevated body temperature — a common early sign of illness — it can automatically trigger Rest Mode, which disables activity goals and adjusts the Readiness Score to emphasize recovery metrics like RHR, HRV balance, recovery index, and body temperature. For home fitness enthusiasts who train alone and may not notice early signs of overtraining or illness, this automated signal is genuinely useful.
Active Heart Rate, Step Count, and Calorie Estimation: Significant Weaknesses
The areas where Oura struggles are the areas where a ring form factor is fundamentally disadvantaged compared to a wrist-worn device. A ring's PPG sensor sits on the finger, which has different blood flow dynamics than the wrist, and the ring has no accelerometer-based arm swing detection for step counting. These are not software problems that can be fixed with an algorithm update — they are hardware constraints.
| Metric | Oura Ring Performance | Best-in-Class Comparison | Verdict |
|---|---|---|---|
| Step count (real-world) | 50.3% error | Garmin: 82.58% accuracy | Poor — do not rely on Oura for step tracking |
| Step count (controlled conditions) | 4.8% error | Garmin: not specified for controlled | Acceptable in controlled settings, poor in real-world |
| Active heart rate during intervals | Not independently validated for Oura | Apple Watch: 86.31% accuracy (r=0.80 vs ECG) | Weak — ring-based PPG struggles with motion artifact |
| Calorie estimation | Not independently validated for Oura | All wearables have high error rates for calorie estimation | Directional at best — applies to all wrist and ring wearables |
The step count data is particularly striking. In real-world conditions, Oura's step count error is 50.3%, meaning the ring routinely misses or overcounts roughly half of steps taken. In controlled laboratory conditions, the error drops to 4.8%, which suggests the ring can count steps accurately when hand movement is predictable and consistent — but real-world walking involves variable arm swing, carrying objects, pushing carts, and other movements that confuse the algorithm. For contrast, Garmin devices achieve 82.58% step count accuracy in real-world conditions, as covered in our Garmin accuracy analysis.
Active heart rate during exercise is another weak area. While Oura's nocturnal HRV and RHR measurements are excellent, the ring's PPG sensor struggles with motion artifact during running, cycling, and especially interval training where heart rate changes rapidly. The Apple Watch leads this category at 86.31% accuracy (r=0.80 correlation vs ECG), and wrist-based optical HR sensors generally outperform ring-based sensors during activity because they have more stable skin contact and larger sensor arrays.
Calorie estimation is a weakness shared by virtually all consumer wearables, and Oura is no exception. Calorie expenditure is a metabolic measurement that requires indirect calorimetry (measuring oxygen consumption and carbon dioxide production) to measure accurately. Wearables can only estimate it from heart rate and movement data, and the error rates are high across all devices. Oura's calorie estimates should be treated as directional at best.
Funding Caveats and Study Limitations
A transparent accuracy assessment requires acknowledging the limitations of the evidence base itself. Several factors affect how broadly these study results can be generalized.
- Small sample sizes: The Dial et al. HRV/RHR study had only 13 participants, though the 536 nights of data provide some statistical compensation. The Oura internal temperature validation had 16 participants. Small sample sizes increase the risk that results may not generalize to the broader population.
- Predominantly Caucasian participants: PPG sensor accuracy varies by skin tone because melanin absorbs light at the wavelengths used by optical heart rate sensors. Most validation studies have predominantly Caucasian participant pools, which means the accuracy figures may not apply equally to users with darker skin tones. Multiple study authors have acknowledged this as a critical research gap.
- Older device generations tested: The sleep staging studies used Oura Ring Gen 2 and Gen 3. The HRV/RHR study used Gen 4. No peer-reviewed study has yet validated the Ring 5's new sensor architecture, which features 12 stronger signal pathways and redesigned sensor domes for better skin contact.
- Funding source correlation: The studies showing the strongest accuracy (Brigham sleep staging, University of Tokyo sleep staging) are Oura-funded or partly Oura-funded. The studies showing more modest results (Park et al. sleep staging) are independent. This does not mean the funded studies are invalid — the University of Tokyo study explicitly states that Oura did not participate in data analysis or writing — but it does mean readers should weight independent results more heavily when making purchase decisions.
Practical Implications: Which Oura Metrics to Trust and Which to Treat as Directional
Based on the available evidence, Oura Ring's metrics fall into three tiers of trustworthiness. This tiered framework can help you decide whether the ring fits your priorities as a home fitness enthusiast.
| Trust Tier | Metrics | Evidence Strength | Best Use Case |
|---|---|---|---|
| High Confidence | Nocturnal HRV, Resting Heart Rate, Skin Temperature | CCC 0.99 (HRV), CCC 0.98 (RHR), r² > 0.99 (temperature) | Recovery decisions, readiness assessment, illness detection |
| Moderate Confidence | Sleep staging (trends), Sleep duration, Sleep onset latency | 75.5%–90.6% accuracy by stage; κ 0.2–0.65 depending on study | Tracking sleep trends over weeks, not absolute nightly values |
| Low Confidence | Step count, Active HR during intervals, Calorie estimation | 50.3% real-world step error; no validated active HR data | Directional awareness only — do not base training decisions on these |
If your primary training goal is recovery optimization — you want to know when your nervous system is ready for a hard session and when you need to back off — Oura Ring is a strong choice. The nocturnal HRV, RHR, and skin temperature data are independently validated at near-laboratory accuracy levels, and the Readiness Score synthesizes these inputs into a single actionable number. For a deeper understanding of how Readiness Score and similar metrics work across devices, see our guide to recovery metrics like HRV, Readiness Score, and Body Battery.
If your primary training goal is activity tracking — you want accurate step counts, real-time heart rate during intervals, and reliable calorie expenditure estimates — Oura Ring is not the right device. A wrist-based tracker from Garmin or Apple will serve you better. Our goal-based decision guide for fitness trackers can help you match your priorities to the right device.
Oura Ring 5: Do the New Sensors Change the Accuracy Picture?
Oura Ring 5 was announced on May 28, 2026 and began shipping on June 4, 2026. It is 40% smaller than Ring 4 (width 6.09mm, thickness 2.28mm) and features a redesigned sensing architecture with 12 stronger signal pathways and precision-engineered low-profile sensor domes designed for better skin contact across more skin tones. Oura claims the pulse signal is up to 100 times stronger than wrist-based wearables.
These are meaningful hardware improvements. The low-profile domes address a known issue with previous generations: inconsistent skin contact, particularly for users with smaller fingers or darker skin tones where the optical signal can be weaker. The 12 signal pathways (up from fewer in Ring 4) should improve signal quality and reduce motion artifact.
However, it is important to note that all accuracy claims for Ring 5 are manufacturer-claimed at this point. No independent peer-reviewed study has validated the Ring 5's sensors against PSG or ECG reference standards. The studies cited in this article used Ring 2, Ring 3, and Gen 4. Until independent validation data is published, the accuracy picture for Ring 5 remains theoretical.
For a broader comparison of how Oura Ring stacks up against other fitness trackers in 2026, including cost, subscription requirements, and feature sets, see our fitness tracker ring buying guide and our best fitness trackers of 2026 roundup.
This is general fitness education, not medical advice. For diagnosis or treatment of pain or injury, consult a qualified clinician.
Pick your next session
Browse all routines to find an appropriately-spaced next session.
Spot something off?
This content sits adjacent to health guidance — tell us if a citation or figure needs a correction.