The morning dashboard usually arrives as a pile of confidence: sleep score, recovery score, HRV, resting heart rate, deep sleep percentage, respiratory rate, maybe skin temperature or body battery. The app colors one number green and another red, and suddenly a normal training decision feels like it needs a lab coat.
If you want sleep and recovery wearable data explained in a way that actually helps your next workout, the first move is not choosing which brand to trust most. It is sorting the numbers by what they can reasonably support.
| Use often | Watch as a trend | Treat cautiously |
|---|---|---|
| Total sleep time, sleep/wake timing, resting heart rate | HRV, respiratory rate, temperature deviation, multi-week sleep regularity | Deep sleep %, REM %, single-night sleep score, cross-device recovery score comparisons |
| Good for basic daily context and 2–4 week patterns | Useful when compared with your own baseline | Interesting, but weak as stand-alone training commands |
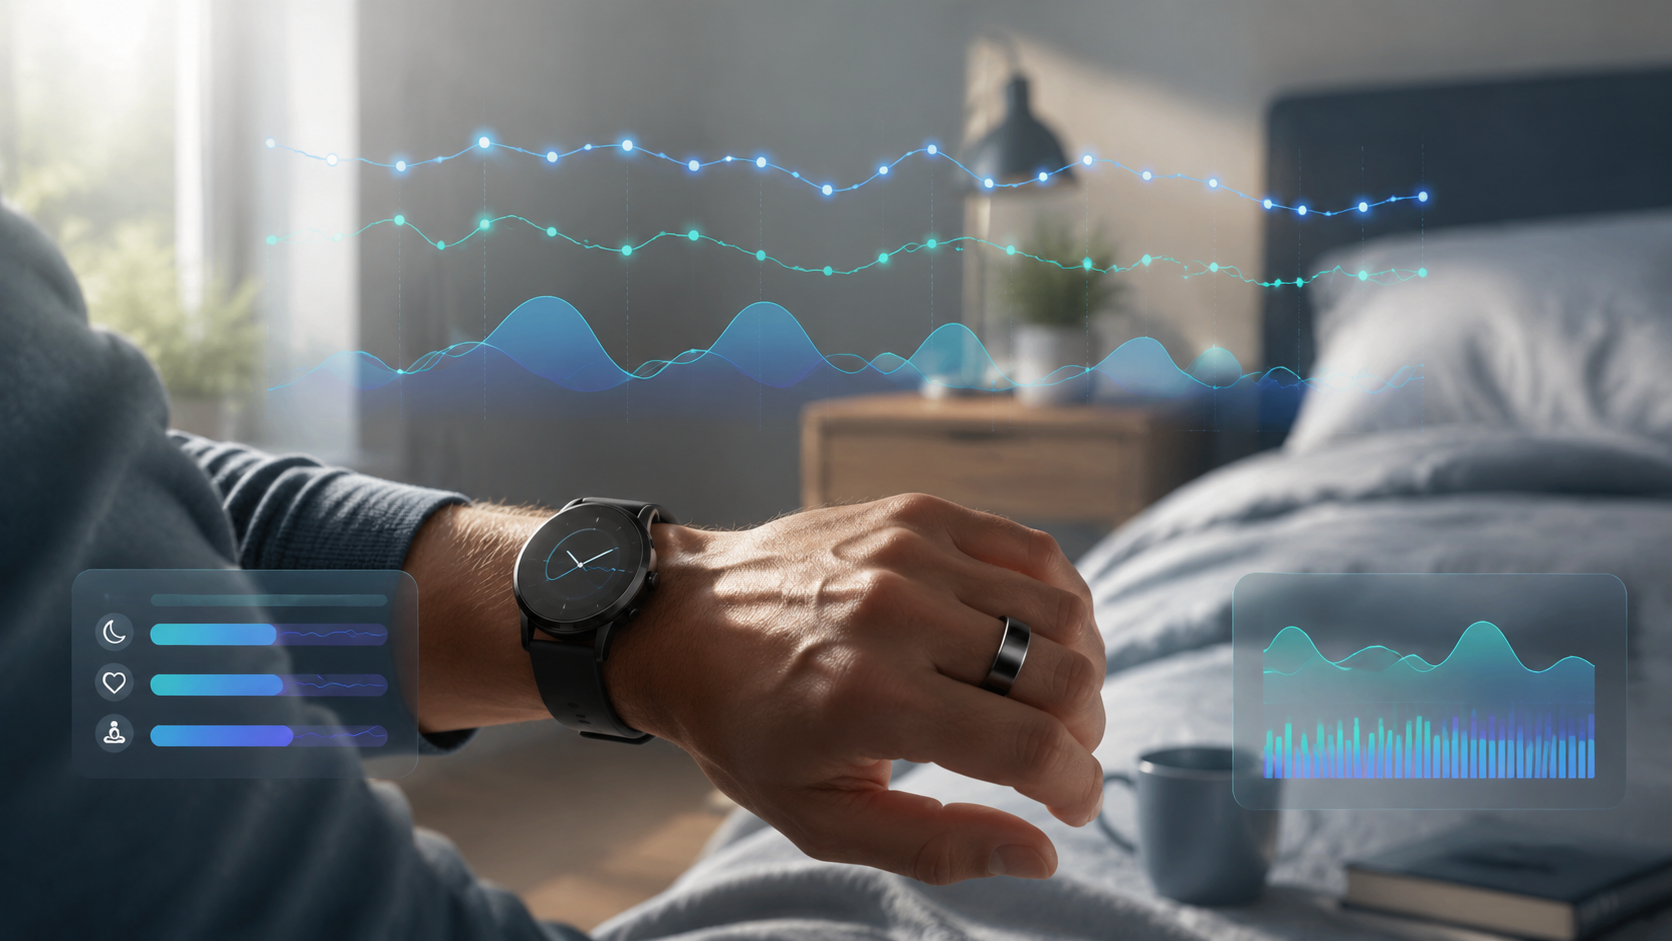
That sorting matters because wearables mix direct sensor readings, estimated states, and proprietary scores on the same screen. A resting heart rate number is not built the same way as a readiness score. Total sleep time is not built the same way as deep sleep percentage. HRV is not useful because it can diagnose your nervous system in one night; it is useful because a repeated personal baseline can show when your body is drifting away from its usual pattern.
Start With What the Sensor Is Actually Measuring
Most sleep and recovery wearables rely on a few physical signals. An accelerometer estimates movement. Optical heart-rate sensors, usually photoplethysmography or PPG, estimate pulse from blood-volume changes near the skin. Some devices add temperature, blood oxygen, or respiratory-rate estimates. The app then uses an algorithm to translate those signals into sleep, wake, sleep stages, recovery, readiness, strain, stress, or body battery.
That chain creates different levels of trust. A device can be pretty good at noticing that you were mostly still, your heart rate dropped, and you were probably asleep. It has a harder job deciding whether a specific 30-second block was REM, light sleep, or deep sleep. By the time the app turns those estimates into a single score, you are looking at a brand’s interpretation of several imperfect inputs.
Total Sleep Time: Useful, Especially When You Stop Treating It as Exact
Total sleep time is one of the better daily numbers because it asks a simpler question than sleep staging: were you asleep or awake? In a 2023 multicenter study comparing 11 consumer sleep trackers with polysomnography, consumer devices identified sleep versus wake epochs above 90%, while sleep-stage accuracy was much lower, with macro F1 scores ranging from 0.26 to 0.69 across devices and stages in 75 participants and 349,114 scored epochs.[1]
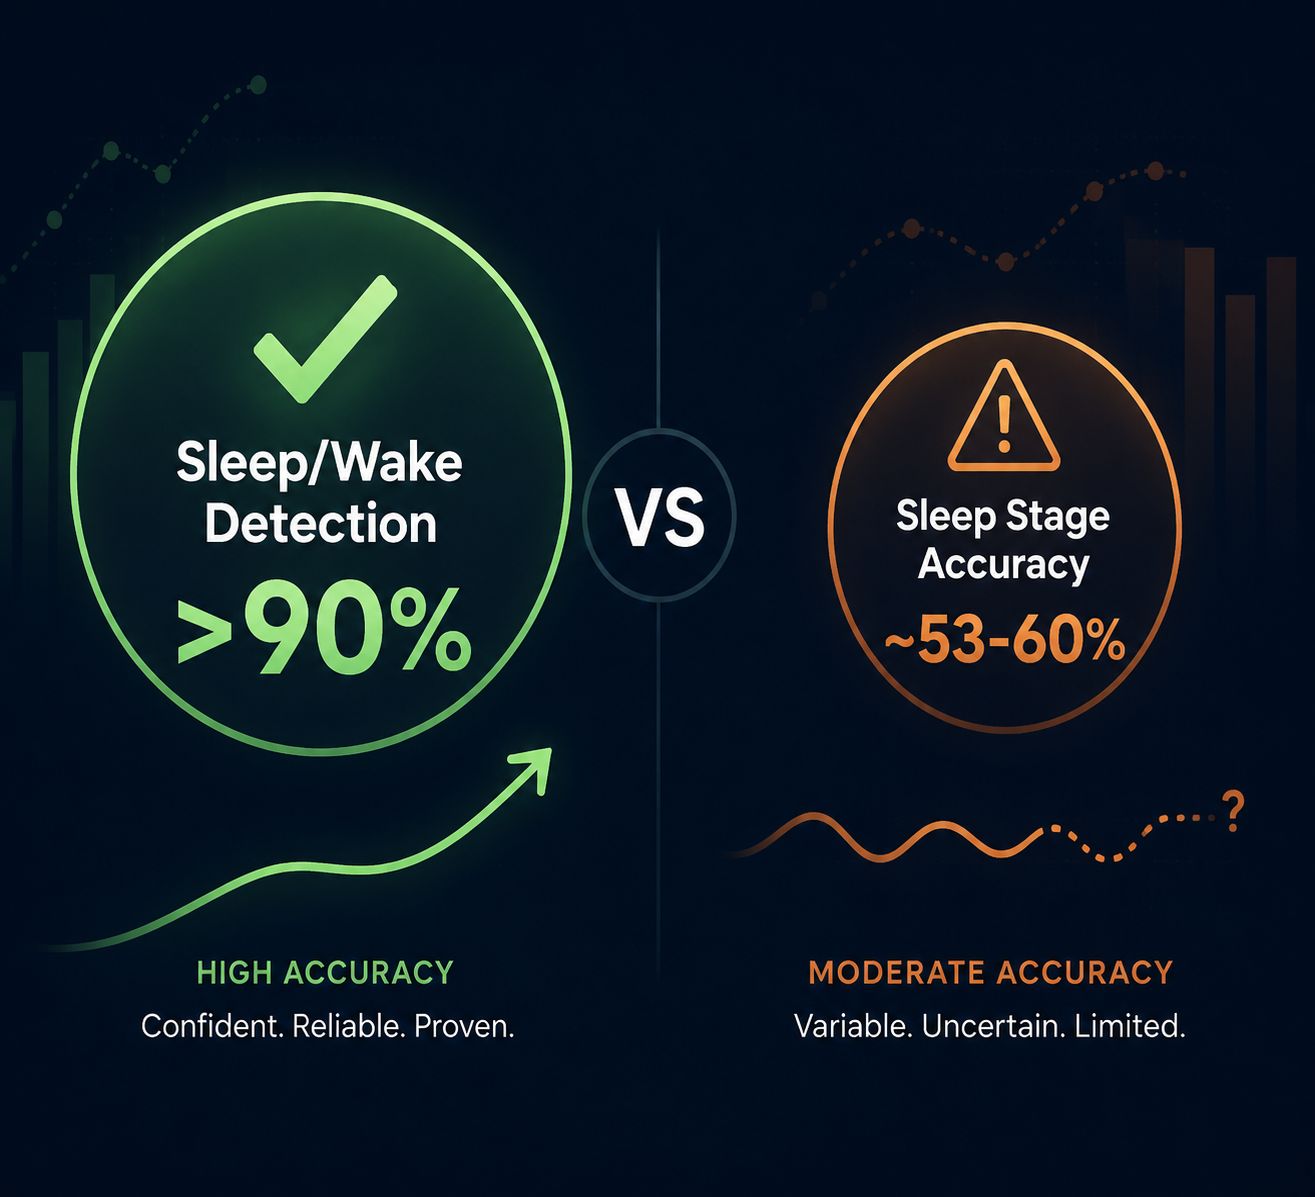
That is the difference between a number worth using and a number worth softening. If your wearable says you slept roughly seven hours instead of five, that probably belongs in your training context. If it says you got 11% deep sleep instead of 18%, that should not automatically change your workout.
Total sleep time still has traps. Quiet wakefulness can look like sleep. Restless sleep can look like wake. A ring may behave differently from a watch if you read in bed, share a bed, or get up briefly and return to sleep. The useful question is not whether last night’s number is perfectly true. It is whether your wearable is consistently showing a pattern: several shorter nights, later bedtimes, more wake after sleep onset, or a clear recovery from a disrupted week.
For home training, total sleep time earns a regular place in the morning check. A single short night does not forbid intensity, but two or three short nights in a row should make heavy intervals, max-effort lifting, or a high-volume session less attractive. That is especially true when resting heart rate is also elevated or HRV is meaningfully below your usual range.
Sleep Stages: Interesting, Directional, and Too Fragile for Daily Verdicts
Deep sleep, REM sleep, and light sleep look precise in an app because they are displayed as clean percentages. The measurement is not that clean. In the same 2023 PSG comparison, sleep/wake detection was above 90%, but sleep-stage classification was only in the 53–60% range at the epoch level, meaning a large share of individual 30-second blocks were classified differently from the reference method.[1]
That does not make sleep stages useless. If your device usually shows a stable REM pattern and then a week of travel makes everything look fragmented, the direction may be telling you something. The problem begins when a single percentage becomes a moral judgment. A low deep-sleep number can come from the algorithm, not from a failed night.
A large real-world Terra Research benchmark of 4,956 users illustrates the algorithm problem clearly: Apple Watch reported deep sleep around 10.5%, while Garmin, Fitbit, and Oura clustered closer to 18%.[2] That gap should not be read as Apple Watch users having physiologically different sleep. It is a platform difference in how sleep stages are classified.
Light sleep can also become a catch-all bucket. When a device is unsure whether you were awake, in REM, or in deep sleep, a conservative algorithm may push more time into light sleep. The result feels plausible because everyone expects light sleep to be common, but the exact split can be more about classification behavior than your body’s precise architecture that night.
The practical rule is simple: do not cancel or upgrade a workout because of one sleep-stage percentage. Use stages as a curiosity and a longer-term context signal. If deep sleep appears unusually low for many nights and you also feel persistently fatigued, that is worth attention. If the app throws one strange number after an otherwise normal night, let it pass.
Resting Heart Rate: One of the Cleaner Recovery Signals
Resting heart rate is easier to use than most recovery metrics because the question is narrow: how fast is your heart beating when you are at rest, often during sleep? Wearables estimate it from optical pulse readings, then select low-motion periods that fit the device’s definition of rest.
RHR is not glamorous, but it is useful. When your normal overnight resting heart rate rises for several days, it can reflect accumulated training stress, poor sleep, alcohol, illness, heat, dehydration, or emotional stress. The wearable usually cannot tell you which one is responsible. It can show that your baseline has moved.
The decision value comes from pairing RHR with other signals. A slightly higher RHR after a hard leg session may be expected. A higher RHR plus shorter sleep plus a clear HRV drop deserves more caution. If your plan was a hard conditioning session, that may become a lower-intensity Zone 2 ride, a technique session, mobility work, or a rest day.
Because RHR responds to more than training, it should not be treated as a fitness grade. A lower number is not always better, and a higher number is not always failure. Watch your own range over 2–4 weeks, especially the nights after hard training blocks, poor sleep, travel, or suspected illness.
HRV: The Number to Respect, Not Obey
Heart rate variability measures variation in the time between heartbeats. Recovery apps often frame it as a window into autonomic nervous system balance, but the morning use case is narrower: compared with your own baseline, is your system behaving normally, or does it look suppressed?
Device accuracy is not identical. In a 2025 comparison of 536 nights from 13 participants, Oura Gen 4 showed concordance correlation coefficient 0.99 with mean absolute percentage error 5.96%, WHOOP 4.0 showed CCC 0.94 with MAPE 8.17%, and Garmin Fenix 6 showed CCC 0.87 with MAPE 10.52%.[3] That is a meaningful spread, and it is one reason cross-device arguments get messy quickly.
The more useful finding is not that one absolute HRV value wins. It is that relative change is easier to act on than a raw number. A practical rule of thumb is a 15% HRV drop from your personal baseline: when the focus shifts from absolute values to relative trends over 2–4 weeks, the main devices are more aligned in catching that kind of drop.
That does not mean a 15% dip is a diagnosis or an automatic rest command. It means the planned session should earn a second look. If HRV is down around that magnitude and RHR is up, sleep was short, or you feel flat during warm-up, reducing intensity is a sane choice. If HRV is down but everything else is normal and you feel good, you might train as planned and watch what happens over the next day or two.
- Use HRV against your own baseline, not your friend’s number or a different device’s scale.
- Look for repeated suppression over several nights, not one odd reading.
- Pair HRV with RHR, sleep duration, training load, and how warm-up feels.
- Avoid switching devices mid-block if you are using HRV to guide training decisions.
Respiratory Rate, Temperature, and SpO2: Context Signals, Not Workout Scores
Respiratory rate, skin temperature, and blood oxygen estimates often sit quietly under the main recovery score. They are not usually the first numbers to use for programming a home workout, but they can add context when something feels off.
A respiratory-rate change may matter more when it persists or appears alongside poor sleep, elevated RHR, unusual fatigue, or symptoms. Temperature deviation can be useful as an early warning that your body is under some kind of stress, though a wearable cannot tell you the cause. SpO2 estimates can be noisy and device-dependent, and they should not be used to self-diagnose.
These are the numbers to keep in the dashboard, not the numbers to dramatize. If they are stable, they mostly reassure. If they change in a concerning way or line up with symptoms, the next step is not a harder or easier workout based on the app. It is paying attention to your body and, when appropriate, getting medical advice.
Composite Recovery Scores: Convenient, Branded, and Not Interchangeable
Recovery scores are useful because they reduce friction. You open the app, see one color, and immediately know how the device is interpreting the night. They are also the easiest numbers to overbelieve because they look more authoritative than their ingredients allow.
WHOOP Recovery, Oura Readiness, and Garmin’s Body Battery or Training Readiness are not the same score with different branding. WHOOP emphasizes HRV measured during the last deep-sleep cycle, along with RHR, respiratory rate, SpO2, and skin temperature. Oura Readiness includes RHR versus personal average, 14-day HRV balance weighted toward recent days, body temperature deviation, sleep quality, and recent activity. Garmin separates a real-time Body Battery concept from Training Readiness, which uses sleep quality, recovery time, 7-day HRV Status, stress history, and short-term training load.
That is why comparing an Oura Readiness of 78 with a Garmin Training Readiness of 78 is not meaningful. The inputs, weighting, and baseline logic differ. If you want a deeper breakdown of those packaged scores, the narrower explainer on what your fitness tracker’s recovery score actually measures is the better place to compare ingredients. For daily use, the important point is simpler: learn how your device behaves for you, then stop treating another brand’s scale as a reference standard.
| Score | What it is best for | What not to do |
|---|---|---|
| WHOOP Recovery | Seeing how overnight physiology compares with your baseline | Treat the color as a diagnosis |
| Oura Readiness | Combining sleep, HRV balance, temperature, RHR, and recent activity into a morning signal | Assume the score equals another brand’s readiness number |
| Garmin Body Battery / Training Readiness | Connecting sleep, stress, HRV status, recovery time, and training load | Ignore the underlying trend lines and obey the headline score alone |
How to Decide Whether to Train Hard Today
The best use of wearable recovery data is not letting the app choose your workout. It is using the app to decide how much skepticism your original plan deserves.
If total sleep time is normal, RHR is near your baseline, HRV is within its usual range, and you feel normal during warm-up, train normally. The sleep-stage chart can be ugly and still not matter much. A strange REM or deep-sleep percentage does not outweigh stable primary signals and a body that feels ready to move.
If sleep was short but RHR and HRV are stable, keep the plan but reduce the cost of being wrong. That might mean stopping one set early, keeping intervals submaximal, choosing strength practice over testing, or avoiding extra finishers. The goal is not to punish a bad night; it is to leave room for recovery if the next night is also poor.
If HRV is down around 15% from your personal baseline and RHR is elevated, the app has earned your attention. Add short sleep, soreness, illness symptoms, or a poor warm-up, and the case for reducing intensity gets stronger. For a home exerciser, that can mean swapping heavy lower-body work for mobility and easy cardio, changing intervals to Zone 2, or moving the hard session by a day.
If only the composite score is low, open the ingredients before changing the day. A readiness score may be reacting to yesterday’s activity, a temperature deviation, a sleep-stage estimate, or a short sleep window. Some of those deserve action; some deserve a note and nothing more.
- Green score, stable trends: train as planned.
- Short sleep only: train, but trim volume or intensity if warm-up feels poor.
- HRV meaningfully down plus RHR up: reduce intensity or move the hard session.
- Bad sleep-stage percentage only: do not rewrite the day.
- Persistent fatigue, symptoms, or concerning heart-rate or respiratory changes: treat it as a health signal, not a training puzzle.
This approach fits home training because it protects both sides of the mistake. You do not skip useful workouts every time an algorithm looks disappointed. You also do not force intensity when several independent signals are pointing away from readiness. If you are building a broader recovery routine around these decisions, connect the trend data to practical choices like session spacing, easy days, food, and sleep opportunity rather than chasing a perfect score; the post-workout recovery routine at home can help turn those signals into habits.
A Few Accuracy Caveats That Should Change How You Read the Screen
Validation studies are useful, but they are not the same as a guarantee for every person, device, firmware version, skin tone, and sleep environment. The HRV comparison cited above included 13 participants across 536 nights, and the Garmin model tested was Fenix 6 hardware, which is older than current Garmin generations.[3] That does not make the finding irrelevant; it means the exact ranking may shift as hardware and algorithms change.
PPG-based sensors can also be affected by skin pigmentation, sensor fit, movement, tattoos, ambient light, and where the device sits on the body. Many validation populations have not represented every user equally, so a clean-looking accuracy result may not transfer perfectly to everyone wearing the device at home.
Funding and study design matter too. A brand-funded sleep-stage study and an independent comparison can point in different directions, especially when the outcome depends on proprietary algorithms. Real-world platform benchmarks can show how devices differ from one another, but they are not the same thing as ground-truth PSG validation.[2]
The safest reading habit is to keep the hierarchy intact: trust sleep/wake timing more than sleep stages, trust your own repeated HRV and RHR baselines more than absolute scores, and trust converging signals more than a single red tile.
The Practical Rule
Use your wearable as a trend-aware dashboard over 2–4 weeks. Let total sleep time, resting heart rate, and HRV guide the first pass. Let sleep stages stay in the background unless a pattern persists. Let composite recovery scores point you toward the ingredients, not replace them.
For today’s workout, stable trends usually mean train normally. A meaningful HRV drop from your own baseline, especially with elevated RHR or short sleep, means reduce intensity or move the hard session. One weird deep-sleep percentage does not deserve control of your morning. Persistent fatigue, symptoms, or concerning respiratory or heart-rate changes belong with a healthcare professional, not inside a wearable’s verdict.
References
- Performance evaluation of consumer sleep trackers compared with polysomnography, Korean multicenter study, 2023.
- Sleep Tracking Accuracy, Terra Research.
- Dial et al. 2025 wearable HRV comparison, ScienceDirect, 2025.
Comments
Join the discussion with an anonymous comment.