What Whoop Measures: The Raw Data Behind the Score
Before you can evaluate whether the recovery score is trustworthy, you need to understand what Whoop actually measures. The device uses a multi-wavelength optical sensor array on the wrist (or biceps, if you use the sleeve) to collect a set of physiological signals throughout the day and night. These raw inputs form the foundation of every derived metric the app shows you.
According to Whoop's official developer documentation, the device tracks the following primary signals:
- Heart rate (HR) — measured continuously via photoplethysmography (PPG), the optical method that detects blood volume changes under the skin.
- Heart rate variability (HRV) — the variation in time between consecutive heartbeats, extracted from the same PPG signal during periods of rest.
- Resting heart rate (RHR) — your lowest heart rate during a sleep cycle, averaged over the night.
- Respiratory rate — the number of breaths per minute, derived from the modulation of the PPG signal caused by breathing.
- Sleep stages — light, deep (slow-wave), and REM sleep, classified using a combination of HRV, RHR, respiratory rate, and movement data.
- Blood oxygen saturation (SpO2) — an estimate of oxygen levels in the blood, available on Whoop 4.0 and 5.0.
- Skin temperature — measured via a thermistor on the underside of the device, used to detect deviations from your baseline.
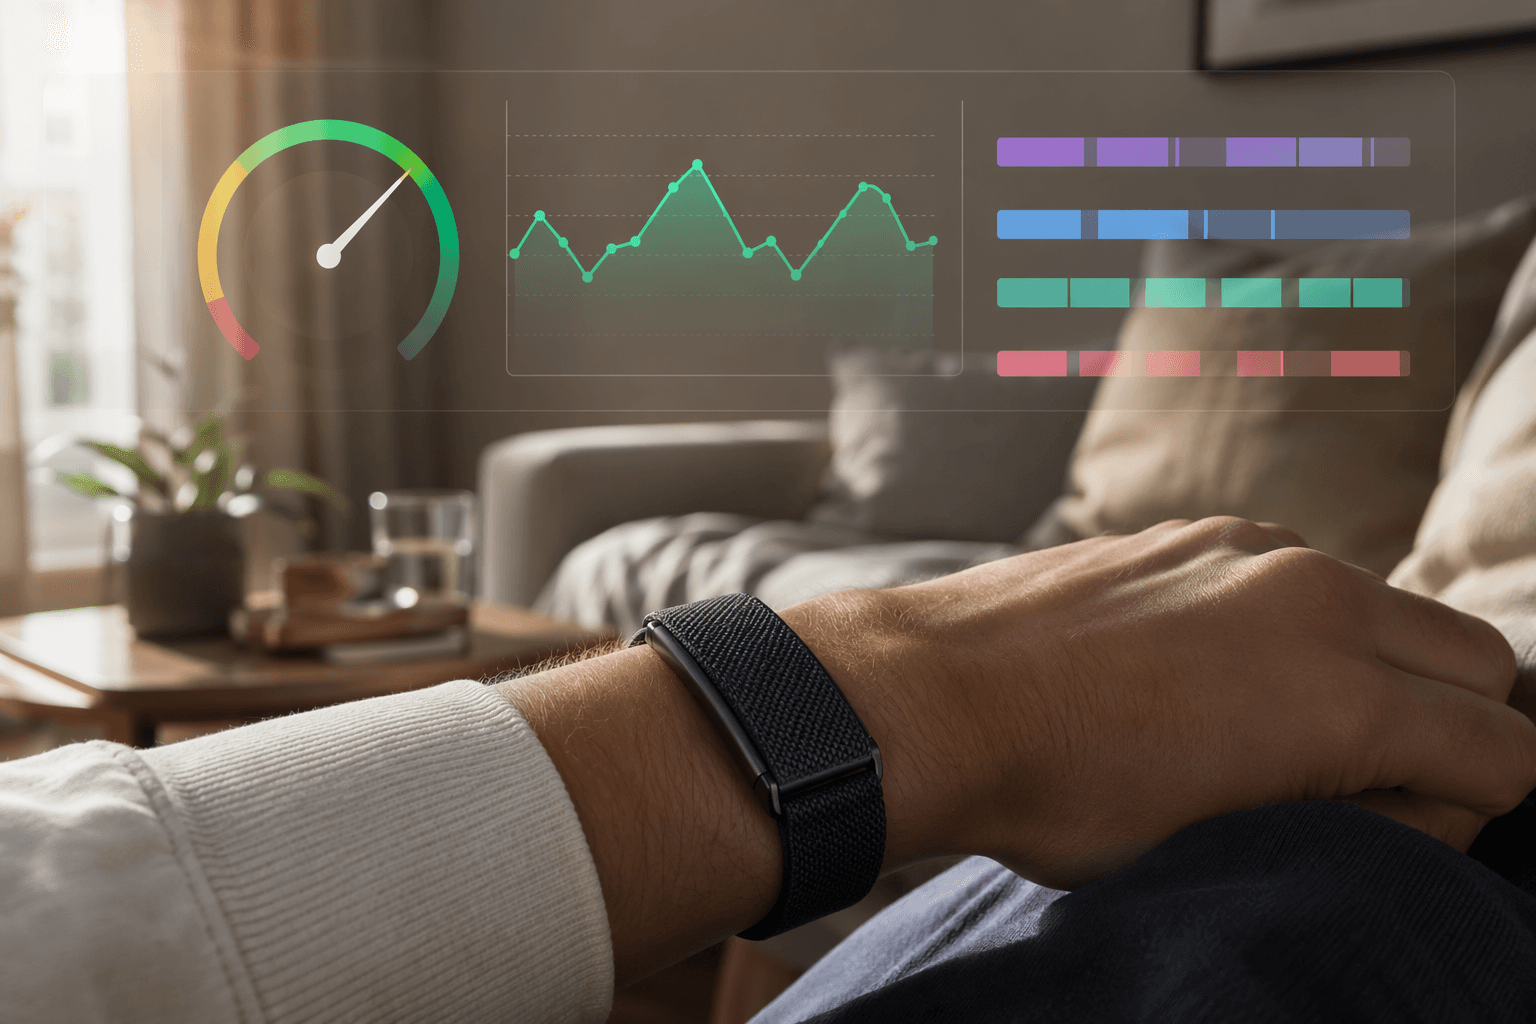
The key distinction here is that Whoop is a screenless device. It does not display real-time heart rate during a workout unless you check the app. Its design philosophy is passive, continuous data collection — you wear it, it logs, and you review the results later. This design choice has implications for both accuracy and user experience, which we will examine in the sections below.
How the Recovery Score Is Calculated
Whoop's recovery score is a daily 0–100% metric that answers one question: how prepared is your body for physical exertion today? The score is calculated during your last sleep cycle and does not change during the day unless you edit your sleep log. This is a deliberate design choice — it gives you a stable morning reference point rather than a constantly shifting number.
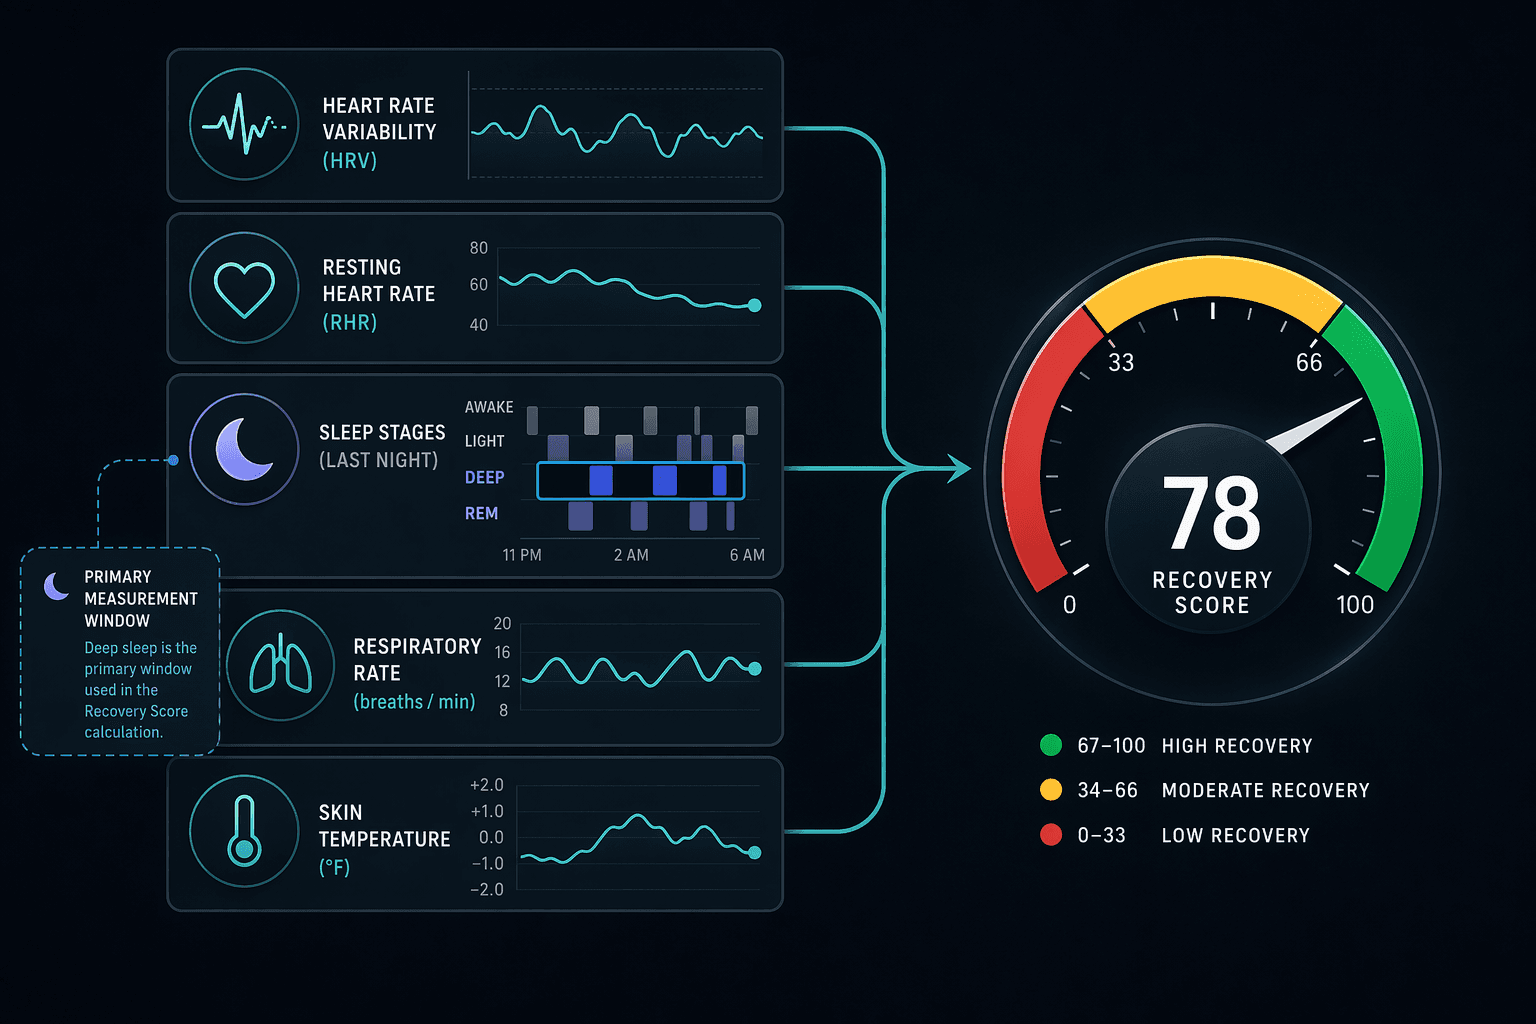
The algorithm is proprietary, so the exact weighting of each input is not publicly disclosed. However, Whoop's developer documentation and public statements reveal the high-level framework. The primary input is HRV, specifically measured during the last five minutes of your deep sleep cycle. This is the period when your body is most physiologically stable — no movement, no conscious thought, minimal external interference. Whoop considers this the cleanest window for measuring your autonomic nervous system balance.
The other inputs are weighted alongside HRV:
- Resting heart rate — a lower RHR relative to your baseline suggests better recovery.
- Respiratory rate — deviations from your personal baseline can signal illness or incomplete recovery.
- Sleep duration and quality — total sleep time, time in each stage, and sleep efficiency all factor in.
- Skin temperature — sustained elevations above baseline can indicate inflammation or illness.
- Blood oxygen saturation — significant drops may flag respiratory issues.
The output is color-coded: Green (67–100%) means you are well-recovered and ready for high strain. Yellow (34–66%) suggests you are maintaining — you can train, but be mindful of intensity. Red (0–33%) indicates rest is likely needed, and the app will recommend a recovery day or low-strain activity.
The Validation Evidence: What the Studies Actually Show
Whoop's accuracy claims rest heavily on a single high-profile study: the Australian Institute of Sport (AIS) and Central Queensland University validation, published in the journal Sensors in 2022. The study compared six wearable devices against gold-standard ECG and polysomnography (PSG) in 53 healthy adults. Whoop 3.0 delivered the most accurate heart rate and HRV measurements among the tested devices, with a heart rate standard deviation of just 1 beat per minute and an HRV standard deviation of 3.9 milliseconds. The other devices ranged from 2.1 to 12.8 bpm for HR and 28.1 to 46.9 ms for HRV.
Whoop translates these results into a marketing claim of 99.7% accuracy for heart rate and 99% accuracy for HRV versus gold-standard ECG. But there are important caveats.
| Study | Metric | Result | Key Caveat |
|---|---|---|---|
| AIS/CQ University (Sensors, 2022) | HR accuracy vs. ECG | SD of 1 bpm (best among 6 devices) | Conducted on Whoop 3.0; study funded by WHOOP |
| AIS/CQ University (Sensors, 2022) | HRV accuracy vs. ECG | SD of 3.9 ms (best among 6 devices) | Conducted on Whoop 3.0; study funded by WHOOP |
| Miller et al. (J. Sports Sciences, 2020) | Sleep/wake detection | 89% agreement with PSG | Only 12 adults; requires manual bedtime entry |
| Miller et al. (J. Sports Sciences, 2020) | 4-stage sleep staging | 64% agreement with PSG | Moderate agreement; κ=0.47 |
| the5krunner (2025-2026) | Biceps HR correlation (19 workouts) | r=0.98 vs. chest strap | Wrist accuracy significantly worse during exercise |
| Michael Kummer (independent) | CrossFit HR accuracy | 58% within 5 bpm vs. chest strap | Small sample; single-subject experiment |
The AIS study was conducted on Whoop 3.0, not the current 5.0 or MG models. Whoop states that the 5.0 and MG feature an upgraded sensor array and refined signal processing, with the heart rate algorithm having undergone a comprehensive rework. However, no equivalent peer-reviewed validation has been published for the newer hardware. Additionally, the study authors disclosed that the CQ University research group receives support from WHOOP Inc., though they state WHOOP was not involved in study design, conduct, or reporting.
The sleep validation picture is more mixed. A separate study by Miller et al., published in the Journal of Sports Sciences in 2020, tested Whoop against polysomnography in 12 healthy adults over 86 sleep data points. When bedtimes were manually entered, Whoop overestimated total sleep time by only 8.2 minutes on average — a non-significant difference. For two-stage sleep/wake categorization, it achieved 89% agreement with 95% sensitivity to sleep. However, for four-stage sleep staging (wake, light, deep, REM), agreement dropped to 64%. The study concluded that Whoop is a reasonable method for estimating sleep, particularly for two-stage categorization, if accurate bedtimes are manually entered.
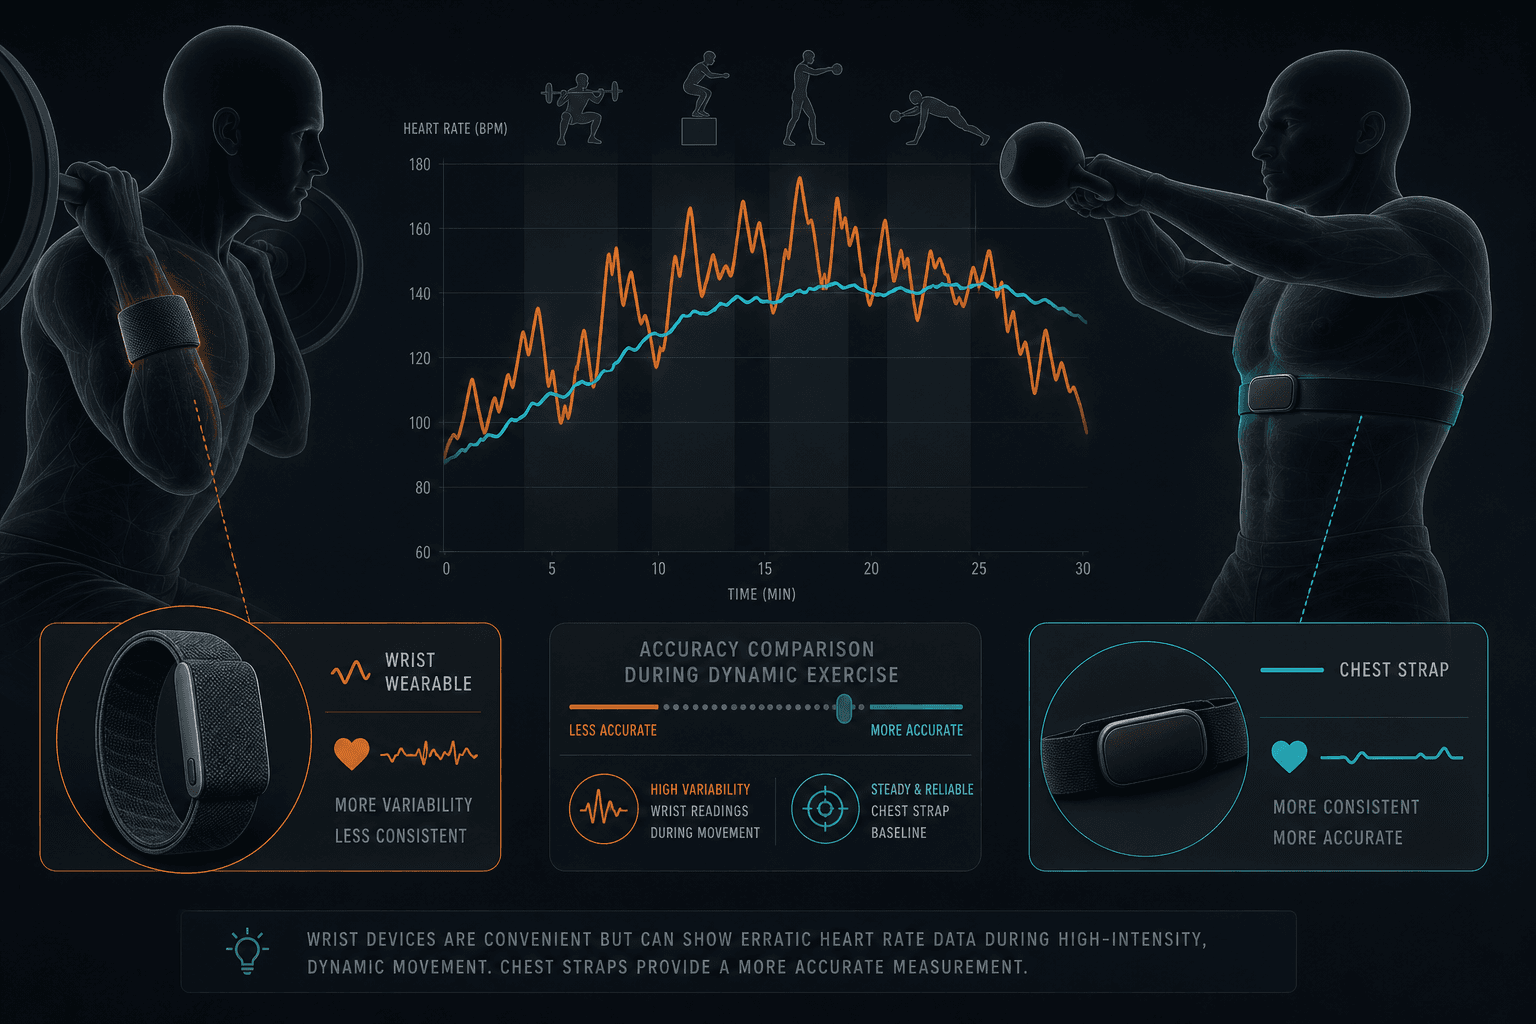
Key Limitations: Wrist-Based Accuracy During Exercise
The validation data above applies almost entirely to resting and sleeping conditions — when you are still, and the optical sensor has a clean signal. The moment you start moving, the picture changes dramatically.
Independent tester Michael Kummer conducted a head-to-head experiment comparing Whoop to a Wahoo chest strap during a CrossFit workout. The results were sobering: only 58% of Whoop's heart rate readings fell within 5 beats per minute of the chest strap. Even expanding the tolerance to 10 bpm, only 81% of readings matched. During a brisk outdoor walk, the average delta was a more respectable 3.8 bpm, with 95% of readings within 10 bpm. The difference between rest and exercise is stark.
The5krunner, a long-time Whoop user who has tested every generation extensively, found a similar pattern. When worn on the biceps using Whoop's sleeve, the 5.0/MG showed a 0.98 correlation with a reference chest strap across 19 workouts spanning HYROX simulations, runs, open water swims, and cycling. But when worn on the wrist during HYROX simulations, accuracy deteriorated significantly, with clear deviations from the reference heart rate.
A Danish study cited by Kummer tested Whoop 3.0 during weight training with 29 participants and found heart rate error rates ranging from 4.4% to 14.8%. This is a meaningful range — at a true heart rate of 150 bpm, a 14.8% error means the device could be off by 22 beats. For strength training, where heart rate spikes and drops rapidly between sets, the wrist-based optical sensor struggles to keep up.
Marco Altini, a data scientist and HRV researcher who developed the HRV4Training app, has been a consistent critic of wrist-based optical sensors. In an interview with Michael Easter for the Two Percent newsletter, Altini stated that the wrist is one of the most challenging locations for optical sensors to provide accurate data, and during movement, wrist-based heart rate data becomes extremely unreliable.
This creates a specific blind spot for Whoop's strain measurement during strength training and high-intensity interval work. If the heart rate data feeding into the strain score is inaccurate, the strain score itself becomes unreliable. A sports researcher quoted in Easter's series put it bluntly: given that the WHOOP strap has displayed limited HR accuracy, they would be hesitant to use the strain metric in research.
The Recovery Score vs. Readiness Debate
Beyond the hardware limitations, there is a deeper debate about whether the recovery score itself is a valid construct. The criticism, articulated most forcefully by Marco Altini, is that the recovery score bundles behavior assumptions with physiology in a way that can mislead rather than inform.
Altini's argument goes like this: if you sleep poorly, your recovery score will be low. But the score does not tell you whether the low score is driven by physiological stress (e.g., overtraining, illness) or simply by the behavioral fact that you slept fewer hours. The algorithm cannot distinguish between these causes. It treats the outcome (low HRV, high RHR) as a signal of poor recovery, but it does not account for the fact that some of that signal is just the mechanical consequence of being awake longer.
In a study of swimmers wearing Whoop bands, Altini found that there was zero correlation between the recovery score and all other physiological variables he measured. He told Michael Easter: Please do yourself a favor: if you want to use a wearable, at least use it to look at the physiology and ignore made-up metrics (recovery, readiness, etc.).
Please do yourself a favor: if you want to use a wearable, at least use it to look at the physiology and ignore made-up metrics (recovery, readiness, etc.).
This is a strong claim, and it is important to note that it represents one expert's opinion rather than a settled scientific consensus. Altini's perspective is that the recovery score makes it so that the data reflects assumptions made by a generic algorithm about what recovery should look like, as opposed to what the athlete's physiology actually showed.
Journalist Christie Aschwanden, author of Good to Go: What the Athlete in All of Us Can Learn from the Strange Science of Recovery, offers a complementary perspective. She argues that the very best thing we have is this subjective measure of how do we feel. In other words, your own perception of readiness — how your body feels when you wake up — may be as useful as any algorithmically derived score.
Whoop vs. Oura: Methodological Differences in Recovery Scoring
If you are evaluating Whoop, you are almost certainly also considering the Oura Ring. Both devices offer a daily recovery or readiness score, but the methodologies differ in ways that matter for your training context.
| Dimension | Whoop Recovery Score | Oura Readiness Score |
|---|---|---|
| Primary focus | Training readiness and strain guidance | General wellness and daily readiness |
| Key input weighting | HRV (last 5 min of deep sleep) is primary | HRV, RHR, body temperature, sleep balance, and activity history |
| Score update | Calculated during last sleep cycle; stable all day | Calculated upon waking; can update with daytime naps |
| Output | 0-100% with Green/Yellow/Red zones | 0-100 with Optimal/Good/Pay Attention/Reserve zones |
| Best for | Athletes wanting training-linked recovery data | Users focused on general wellness, sleep, and daily readiness |
| Subscription cost | $199-$359/year (device included) | $299-$449 upfront + $5.99/month membership |
The key difference is philosophical. Whoop's recovery score is explicitly designed to answer the question should I train today, and if so, how hard? It is training-linked and intended to guide strain decisions. Oura's readiness score is broader — it considers your overall readiness for the day, including cognitive and metabolic factors, not just physical training capacity.
Garage Gym Reviews notes that Whoop is better for those who take their training seriously and want coaching on when to train and rest, while Oura is better for step tracking and general wellness. PCMag similarly observes that Whoop's training-linked recovery data is more actionable for athletes, while Oura's readiness score is more suited to everyday wellness monitoring.
For a broader comparison of how different devices calculate recovery and readiness metrics, see our article on health fitness tracker recovery metrics, which covers HRV, readiness scores, and body battery across multiple platforms.
Practical Guidance: Using the Score as a Trend Tool
Given the validation evidence and the limitations we have covered, how should you actually use Whoop's recovery score? The consensus among the most thoughtful reviewers and researchers is clear: treat it as a trend tool, not a daily dictator.
Michael Easter, writing in his Two Percent newsletter, recommends using the recovery score to identify patterns over weeks and months rather than making daily training decisions based on a single morning number. If your recovery scores are consistently trending downward over a week, that is a meaningful signal that you may need a deload week or more sleep. If your score is red on a single morning but you feel fine, you can probably train as planned.
Here are practical guidelines for getting the most out of Whoop's recovery data:
- Combine the score with subjective readiness. Christie Aschwanden's advice to prioritize how you feel is backed by research showing that subjective readiness correlates well with performance. If your score is yellow but you feel great, trust your body.
- Look at trends, not single days. A single red day is noise. A week-long trend of declining recovery scores is a signal worth acting on.
- Wear the device on your biceps during exercise. The5krunner's testing consistently shows that biceps placement yields significantly better heart rate accuracy during sports and strength training.
- Manually enter your bedtime. The Miller et al. sleep validation study found that Whoop's sleep/wake detection accuracy improves significantly when bedtimes are manually entered rather than auto-detected.
- Use the raw HRV and RHR data, not just the composite score. Marco Altini's criticism is specifically about the composite recovery score, not the underlying physiological data. The raw HRV and RHR trends are more interpretable and less prone to algorithmic assumptions.
The bottom line is that Whoop's recovery score is a useful tool when used appropriately. It is not a medical device, not a perfect measure of readiness, and not a substitute for listening to your body. But as a consistent, longitudinal measure of your physiological trends, it provides information that most people would not otherwise have. The key is to use it as one input among many — alongside subjective readiness, training performance data, and common sense.


Comments
Join the discussion with an anonymous comment.