A bad recovery score in the morning is not a command. It is a reason to look at the last several mornings.
That distinction matters if you are using a recovery tracker for overtraining symptoms. One red WHOOP day, one low Oura Readiness score, or one Garmin screen that looks drained can come from a poor night of sleep, alcohol, work stress, travel, illness starting to build, or a hard session you actually planned. The useful signal is not the single ugly number. It is the pattern: HRV dropping below your normal range, resting heart rate rising, sleep getting worse, and your own readiness falling at the same time.
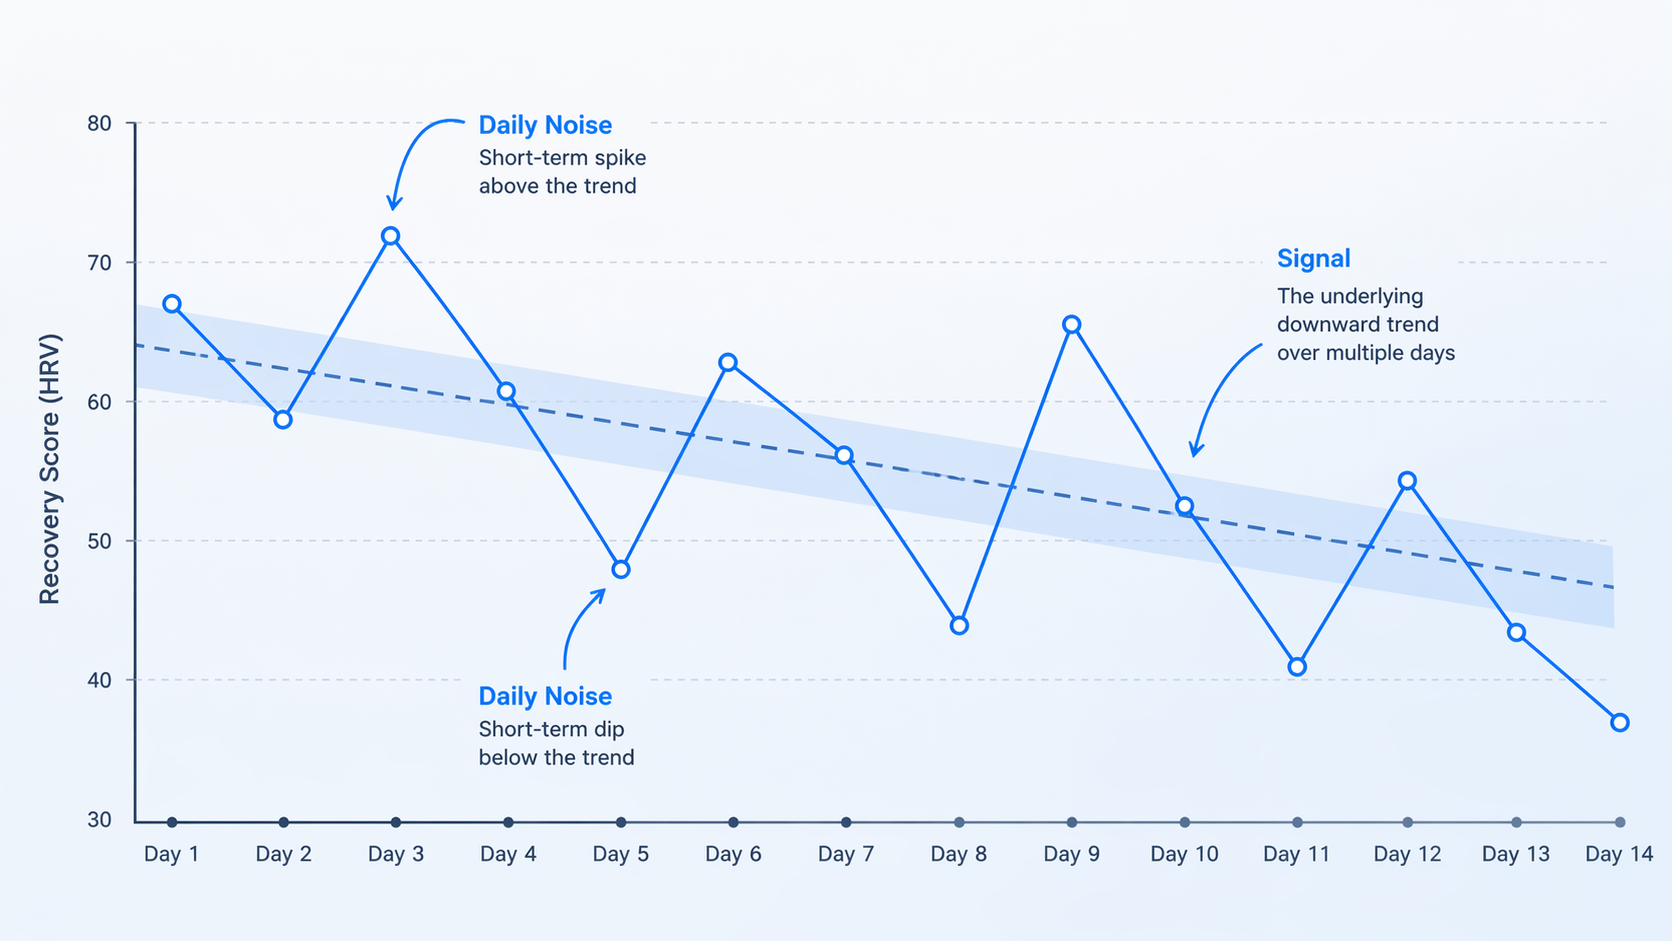
The practical rule is simple enough to use before coffee: treat one bad reading as weak evidence, two to four bad readings as a caution flag, and five or more days of aligned negative trends as something to act on. A coach-facing CardioMood protocol uses a 10–15% HRV drop below personal baseline for five or more consecutive days as an early warning, a 20% or greater drop for seven or more days as a stronger intervention point, and a 30% or greater drop as stop-and-evaluate territory. Those are practical guideposts, not clinical cutoffs for diagnosing overtraining syndrome [1].
No wearable diagnoses overtraining syndrome. Cleveland Clinic describes overtraining syndrome as a diagnosis of exclusion, which means other causes have to be considered rather than letting a watch declare the problem for you [2]. The tracker is still useful because it can make the early slide visible while your brain is still explaining it away as “just a rough week.”
Start With The Four Signals, Not The Brand Score
Most recovery dashboards blend several inputs into one easy color or number. That is convenient, but it can hide the reason the score moved. Before deciding whether to train, check the four signals underneath the score: HRV, resting heart rate, sleep quality, and the composite recovery or readiness score. If you want a deeper breakdown of what each wearable metric actually measures, start with A Practical Guide to Sleep and Recovery Wearable Data.
| Signal | What To Compare | Early Concern | Stronger Concern |
|---|---|---|---|
| HRV | Your own baseline, not another athlete’s number | 10–15% below baseline for 5+ days | 20%+ below baseline for 7+ days; 30%+ below baseline means stop and evaluate [1] |
| Resting heart rate | Your normal morning baseline | About 5 BPM above baseline | About 10 BPM above baseline [1][3] |
| Sleep quality | Efficiency, wakefulness, duration, and whether sleep is getting worse | Poor sleep alongside HRV/RHR changes | Persistent sleep disruption with fatigue and performance decline [2][4] |
| Composite score | Your device’s normal range and recent trend | Dropping into the middle or caution zone | Bottom-zone scores for several days, especially when raw metrics agree |
HRV is the most sensitive early flag for many endurance-style training loads, but it is also easy to overread. A low HRV morning can reflect non-training stress, life events, poor sleep, or menstrual-cycle phase rather than too much training. Stanford Human Performance Alliance notes that HRV can be affected by these non-training stressors and that overtraining research has limitations, including less evidence for resistance-training populations and underrepresentation of female athletes [5].
Resting heart rate is less glamorous, but it is a good reality check. If HRV is down and resting heart rate is up, your body is not just giving you a mysterious app score. It is showing a shift toward higher stress load. CardioMood flags a resting heart rate rise of 5 or more beats per minute above personal baseline as a sign of sympathetic overactivation, and TrainingPeaks gives similar practical guidance around using elevated resting heart rate with HRV to identify recovery problems [1][3].
Sleep makes the signal harder to dismiss. Cleveland Clinic and Hospital for Special Surgery both include sleep disturbance among overtraining-related symptoms, but the important wearable use is not “I slept badly once.” It is that sleep efficiency is falling, wakefulness is increasing, HRV is suppressed, resting heart rate is elevated, and training still looks hard at loads that normally feel manageable [2][4].
Use A Green, Yellow, Red Decision Instead Of A Perfect Score
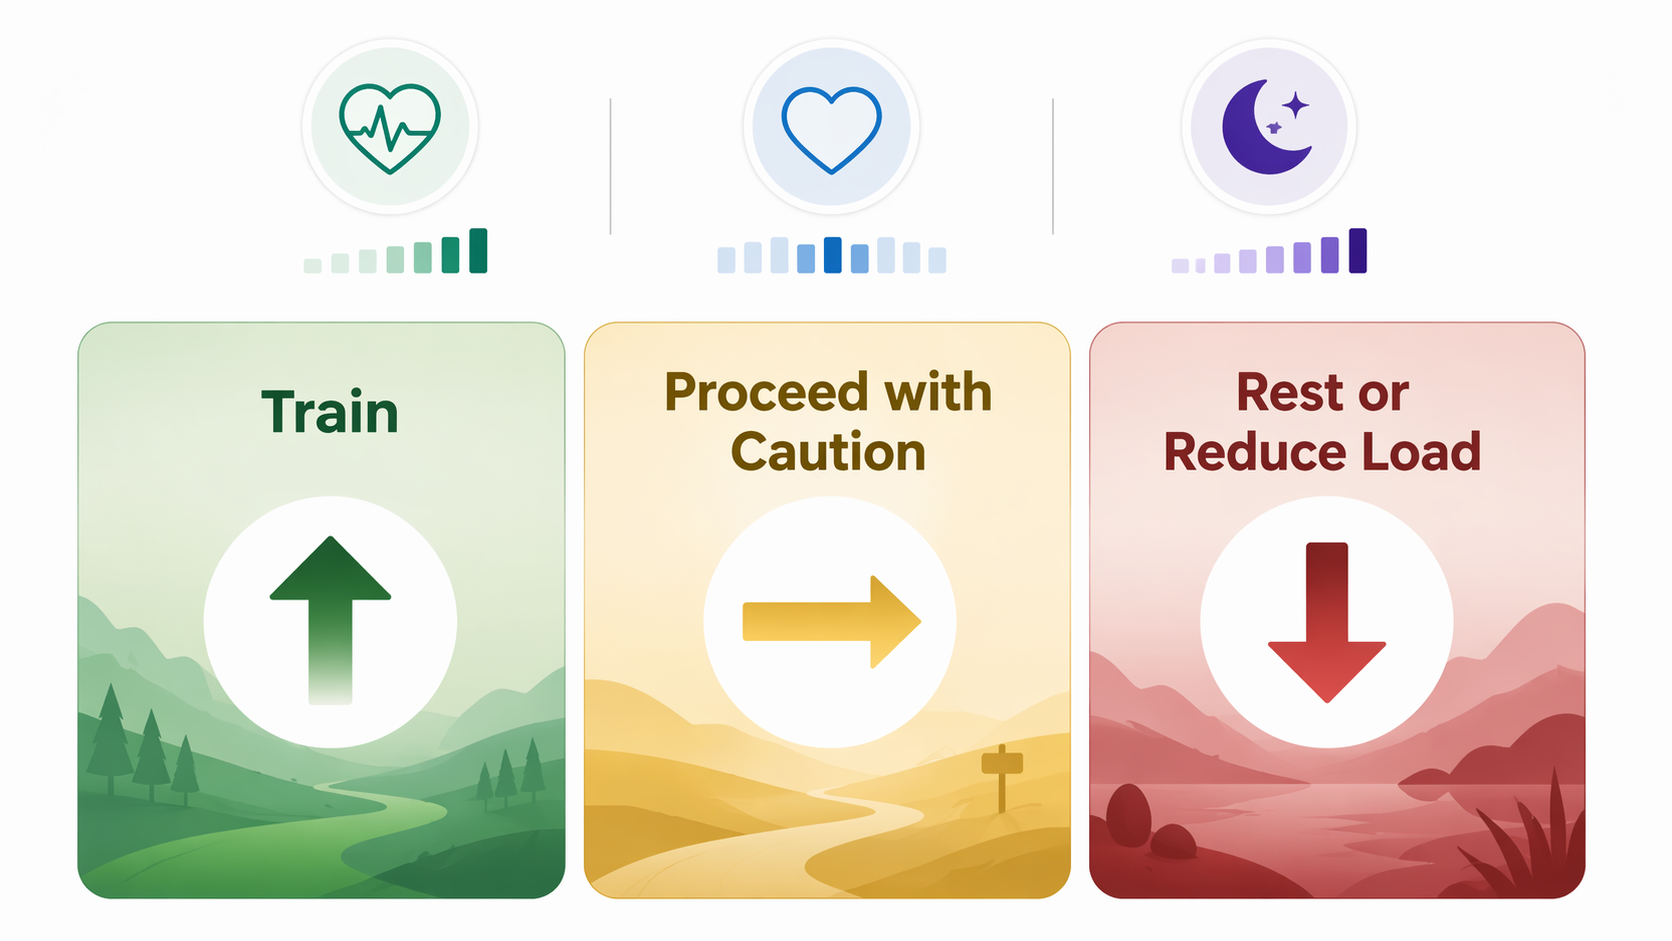
The question is not whether your recovery tracker thinks you are a good person today. The question is what training decision the trend supports. A simple green/yellow/red workflow is usually enough, especially if you train alone and nobody else is watching your fatigue accumulate. For more detail on using HRV in daily programming, see How to Use Your HRV Recovery Score to Plan Today’s Workout.
| Day Type | What The Data Looks Like | What To Do Today |
|---|---|---|
| Green | HRV is within your normal range, resting heart rate is near baseline, recovery score is in the upper zone, and subjective readiness is 7/10 or higher. | Train as planned. |
| Yellow | HRV is 10–15% below baseline for 2–4 days, resting heart rate is 3–5 BPM above baseline, and the recovery score is sliding toward the middle zone. | Reduce intensity or volume. Use zone 1–2 cardio, technique work, mobility, or reduce lifting load by roughly 30–50%. |
| Red | HRV is 15% or more below baseline for 5+ days, resting heart rate is 5+ BPM above baseline, the recovery score is in the bottom zone, and subjective readiness is below 5/10. | Take a complete rest day or do only light walking. If the pattern persists for 7+ days with HRV 20%+ below baseline, consider medical evaluation [1]. |
The yellow day is where most self-coached athletes either get smarter or get expensive. It is easy to negotiate with yourself when the plan says intervals, heavy squats, or a long run. The tracker’s job is not to shame you out of training. It is to make the tradeoff visible: you can still move, but you stop pretending that a depleted system needs another proof-of-discipline session.
On a yellow day, keep the habit and remove the tax. Walk, spin easily, do mobility, practice skill work, or take the first two sets of a lift and leave the rest. If you need a structure for a low-load day, the active recovery options in foam rolling and active recovery for home gym training are more useful than staring at the app and doing nothing.
On a red day, stop trying to win the morning. If multiple signals have been bad for five or more days, a rest day is not dramatic. It is conservative. Cleveland Clinic and HSS both describe recovery from true overtraining syndrome as taking at least 4–14 weeks, depending on severity and the person’s situation [2][4]. One or two easier days now is a much smaller cost than turning a warning trend into a month-long training hole.
What Counts As Noise, And What Counts As A Signal
A recovery tracker becomes more useful when you stop asking it for certainty. Wearables are pattern tools. They are not blood work, they are not a coach, and they are not a diagnosis. The mistake is using them only when they agree with what you already wanted to do.
- Likely noise: one low score after a late night, a stressful workday, alcohol, travel, poor sleep, or an unusually hard session you expected to feel.
- Worth watching: two to four days of depressed HRV, rising resting heart rate, worsening sleep, and lower motivation.
- Worth acting on: five or more days where HRV is meaningfully below baseline, resting heart rate is elevated, sleep is not recovering, and normal training feels unusually hard.
- Worth medical input: a severe or persistent pattern, symptoms that do not improve with rest, or fatigue that feels out of proportion to training.
Menstrual cycle effects deserve extra caution. HRV and resting heart rate can shift across cycle phases, and Stanford HPA specifically notes that cycle phase can affect interpretation [5]. For athletes who menstruate, the most useful baseline is not a single all-time average. It is a personal pattern built across enough cycles to see what is normal for you.
Resistance training also needs a narrower claim. Much of the overtraining and HRV discussion comes from endurance sport contexts, and Stanford HPA notes that evidence is less developed for resistance-training populations [5]. If your main work is lifting in a garage, the tracker can still flag systemic stress, but it may not capture local muscle damage, joint irritation, or technical breakdown as clearly as it captures whole-body autonomic strain.
How To Translate WHOOP, Oura, Garmin, And Polar Into The Same Framework
Brand scores are translations. Useful translations, sometimes, but still translations. If Oura and WHOOP disagree, or Garmin looks fine while your HRV trend looks poor, do not treat the highest score as the truth because it lets you train. Composite scores can weight inputs differently, which is why two devices can give very different-looking recovery judgments from the same body. The breakdown in Oura vs. WHOOP recovery scores is useful if your devices regularly disagree.
WHOOP
WHOOP Recovery uses color zones: green at 67% or higher, yellow from 34–66%, and red below 33%. WHOOP’s internal data, cited by FloTrack, reported that runners using recovery-guided training reduced injury risk by 32%; that figure should be read as WHOOP’s own finding, not as independently replicated proof [6].
In practice, a single WHOOP red day is a yellow conversation with yourself unless the raw metrics and symptoms are also bad. Multiple red recoveries, rising resting heart rate, suppressed HRV, and poor sleep put you into the shared red-day framework. For a deeper score-specific breakdown, use the WHOOP recovery score guide.
Oura
Oura describes Readiness scores above 85 as optimal, 70–84 as good, and below 70 as not fully recovered [7]. A sub-70 score after one disrupted night is not an overtraining alert by itself. Several sub-70 mornings alongside lower HRV, higher resting heart rate, and declining training performance deserve a lighter day or a rest day.
Garmin
Garmin users should separate Body Battery from Training Readiness. Body Battery is a general energy-style estimate across the day; Training Readiness is aimed more directly at whether your recent sleep, HRV status, recovery time, and load support training. If Body Battery keeps starting low and Training Readiness is also poor, treat that as alignment. If only one Garmin screen looks bad, look at the underlying HRV status, sleep, and recent training load before changing the whole day.
Polar
Polar’s overtraining guidance emphasizes combining recovery testing with training load, including tools such as the Orthostatic Test and Training Load Pro. Polar also notes perfectionistic personality traits as a risk factor for overtraining, which is uncomfortably relevant for self-coached athletes who rarely miss sessions and often call every warning sign “lack of discipline” [8].
Build A Baseline Before You Trust A Threshold
The numbers only work if they are compared with your own normal. A 5 BPM resting heart rate rise is meaningful because it is above your baseline, not because it matches someone else’s chart. A 10–15% HRV drop matters because it is below your range, not because your HRV is lower than an influencer’s.
Use the same device, wear it consistently, and compare similar conditions. Morning-to-morning comparisons are usually cleaner than mixing morning readings with readings after caffeine, stress, heat, or a workout. If you switch devices, treat the first few weeks as a new baseline period rather than carrying exact thresholds across platforms.
Composite scores deserve even more restraint. A readiness score can be helpful, but it is a model built from selected inputs and assumptions. If you want to understand what those scores include and what they leave out, read what your fitness tracker’s recovery score actually measures. The validation gap matters too: recovery scores are not clinical proof, and the limitations are covered in more depth in the heart-rate fitness tracker recovery validation gap.
A Practical Morning Check
You do not need a complicated spreadsheet to use a recovery tracker well. You need a short pause before you follow the plan automatically.
- Check HRV against your normal range, not against yesterday alone.
- Check resting heart rate against your morning baseline.
- Look at sleep quality: wakefulness, efficiency, and whether sleep has been getting worse.
- Look at the composite score only after the raw signals.
- Rate subjective readiness honestly from 1–10 before you bargain with the workout.
- Choose green, yellow, or red based on the combined trend.
A hypothetical example: your HRV is 12% below baseline for the third straight morning, resting heart rate is 4 BPM above normal, sleep has been choppy, and your readiness feels like a 6/10. That is not a medical emergency and it is not proof of overtraining syndrome. It is a yellow day. Swap intervals for easy zone 2, cut lifting volume, or take a mobility day.
Another hypothetical example: HRV has been 18% below baseline for six mornings, resting heart rate is 6 BPM above normal, your device score is in the bottom zone, sleep is worse, and normal warmups feel heavy. That is a red day. Rest or keep movement very light. If the pattern keeps going, especially past a week with deeper HRV suppression, medical evaluation is more sensible than hunting for a supplement or forcing a deload workout to prove you are fine [1][2].
If your goal is to improve the score after you have detected the problem, the next move is boring in the best way: sleep, food, lower stress where possible, and load reduction. The guide to science-backed ways to improve WHOOP recovery score is WHOOP-focused, but many of the recovery behaviors are not brand-specific.
The Boundary: Act Early, Do Not Self-Diagnose
A recovery tracker is at its best before the situation becomes obvious. Once training performance has collapsed, sleep is poor, mood is off, resting heart rate is elevated, and fatigue is running your day, the watch is no longer giving you a clever early warning. It is documenting a hole you are already in.
Use the tracker to catch risk earlier: reduce load on yellow days, rest on red days, and get medical help when the pattern is severe, persistent, or out of proportion to training. The goal is not to keep every score green. The goal is to avoid ignoring five mornings of evidence until recovery takes weeks instead of days.
References
- Preventing Overtraining: A Data-Driven Protocol, CardioMood
- Overtraining Syndrome, Cleveland Clinic
- How Monitoring Your Heart Rate Variability Helps You Avoid Overtraining, TrainingPeaks
- Overtraining, Hospital for Special Surgery
- Does Heart Rate Variability Detect Overtraining?, Stanford Human Performance Alliance
- How to Avoid Overtraining and Injury with WHOOP, FloTrack
- Readiness Score, Oura
- Overtraining, Polar

Comments
Join the discussion with an anonymous comment.